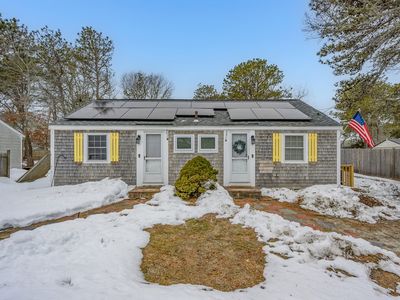
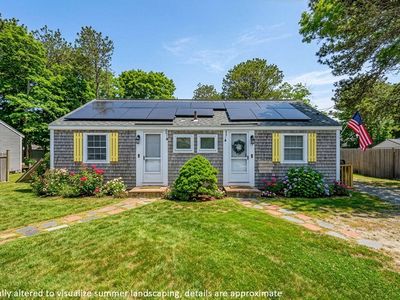
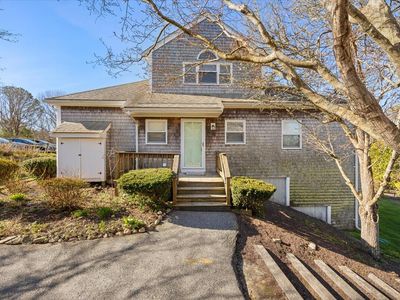
9-11 Thatcher RdSouth YarmouthMA02664
INVESTMENT ANALYSIS
Investment Verdict
Strong Cash FlowThe yield at 9-11 Thatcher Rd, South Yarmouth, MA, 02664 in South Yarmouth speaks for itself: 13.11% gross on a $549,000 price, generating $6,000/mo in rent and $2,540/mo in net income after the $2,469/mo debt service. DSCR 2.43, a wide margin that supports Ziffy Mortgage's DSCR loan without any personal income check. Annual cash flow of $30,477 stacks alongside $151,679 in projected five-year appreciation and $5,056/yr in principal reduction. Projected total cumulative return: $371,845.
| This Property | City Avg | |
|---|---|---|
| Gross Rental Yield | 13.1% | 5.0% |
| Monthly Cash Flow | $2,540 | $1,200 |
City averages based on South Yarmouth market data in our database. Property projections are estimates.
DSCR Rental Loan Qualification
Qualifies using the property's rental income, not your personal income.
- ✓No W-2, pay stubs, or tax returns needed
- ✓Rental income qualifies you
- ✓Built for real estate investors
| Monthly Rental Income | $6,000 |
| Total Monthly Debt Service | $3,242 |
| DSCR Ratio | 1.85x |
Ziffy Mortgage: Your DSCR most likely meets our 1.0+ requirement, so you'll most probably qualify for our standard DSCR investment loan program. To pre-qualify, book time with your loan officer →
Estimates assume 6.0% rate / 30-yr fixed, 30% down, 1% tax, 0.5% insurance. Not a commitment to lend.
Multi Family
Built in 1955
7,841 sqft lot
$N/A/sqft
No HOA
Neighborhood Data
Neighborhood data shown for ZIP Code: 02664, South Yarmouth, MA area.
Housing Distribution
Housing Statistics
| Category | Value |
|---|---|
| Total HU (Housing Units) | 7,409 (100%) |
| Owner Occupied HU | 3,340 (45.1%) |
| Renter Occupied HU | 1,268 (17.1%) |
| Vacant Housing Units | 2,801 (37.8%) |
| Median Home Value | $650,913 |
| Average Home Value | $780,439 |
Housing Distribution
Address Breakdown
Residential
6,454
Single Family
5,964
Multi-Family
490
Businesses
539


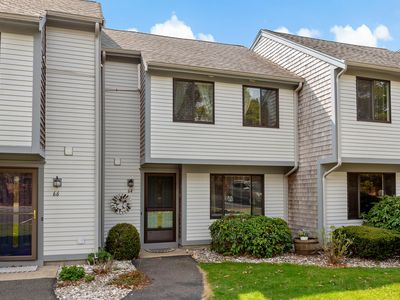
Nearby investment properties with comparable rents
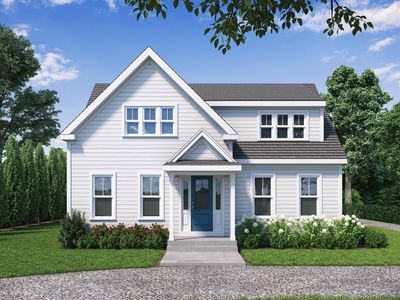
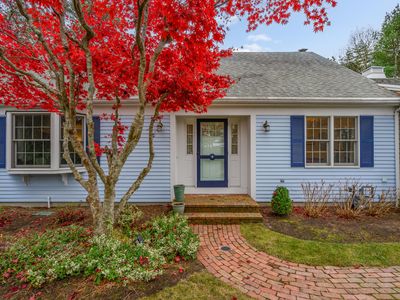
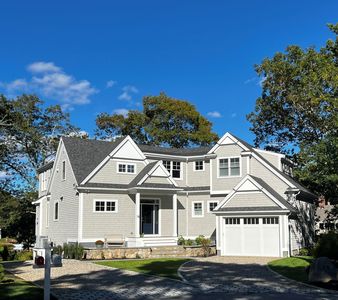
Nearby investment properties with comparable prices

Ziffy AI Summary
A quick, investor-focused snapshot highlighting income strength, yield potential.
| Key metrics | Value |
|---|---|
| Price | $399,900 |
| Est. Rent | $3,200/mo |
| ROI | 18% |
- Attractive rent-to-price ratio for income stability
- Good fit for DSCR financing with healthy coverage
Multi Family
Built in 1955
7,841 sqft lot
$N/A/sqft
No HOA
Neighborhood Data
Neighborhood data shown for ZIP Code: 02664, South Yarmouth, MA area.
Housing Distribution
Housing Statistics
| Category | Value |
|---|---|
| Total HU (Housing Units) | 7,409 (100%) |
| Owner Occupied HU | 3,340 (45.1%) |
| Renter Occupied HU | 1,268 (17.1%) |
| Vacant Housing Units | 2,801 (37.8%) |
| Median Home Value | $650,913 |
| Average Home Value | $780,439 |
Housing Distribution
Address Breakdown
Residential
6,454
Single Family
5,964
Multi-Family
490
Businesses
539
Nearby investment properties with comparable rents
Nearby investment properties with comparable prices
Listed by: N/A • N/A
Mls Name: MLS PIN
Mls ID: #73483482