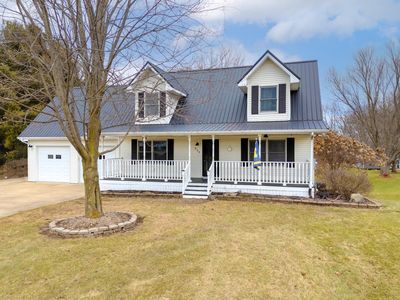
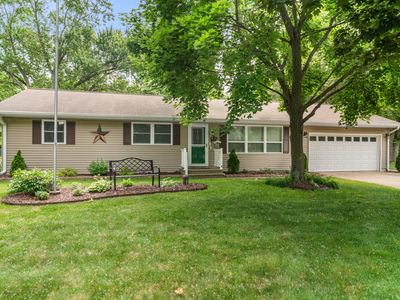
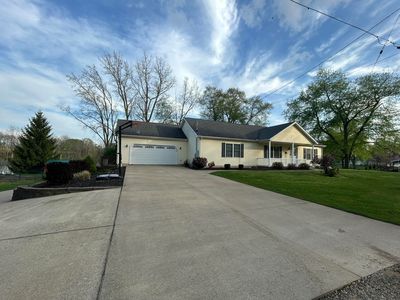
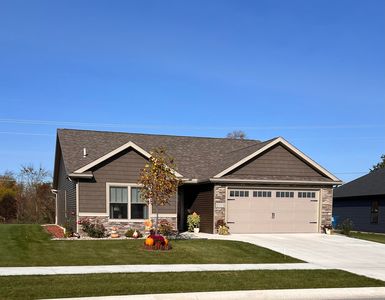
839 Rolling Meadows DrQuincyMI49082


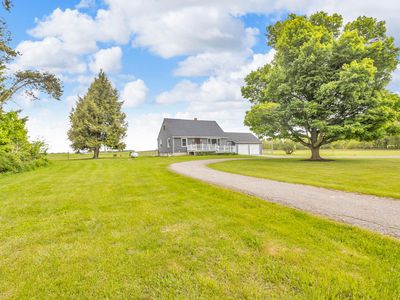
Nearby investment properties with comparable rents
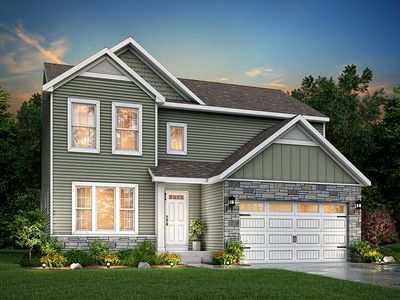
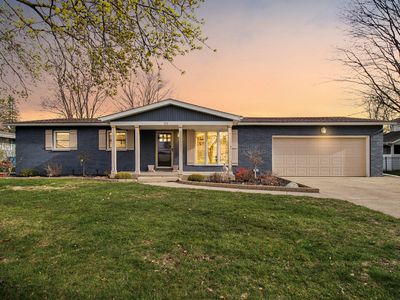
Nearby investment properties with comparable prices

Ziffy AI Summary
A quick, investor-focused snapshot highlighting income strength, yield potential.
| Key metrics | Value |
|---|---|
| Price | $399,900 |
| Est. Rent | $3,200/mo |
| ROI | 18% |
- Attractive rent-to-price ratio for income stability
- Good fit for DSCR financing with healthy coverage
Investment Highlights
Investment property for sale in Quincy at 839 Rolling Meadows Dr, Quincy, MI, 49082 uses $122,622 cash to close to unlock $7,970/yr annual cash flow and $664/mo monthly cash flow. Total monthly income runs $3,103/mo, and a $1,810/mo payment keeps the spread at $664/mo. Purchase price stands at $369,900, and rental yield measures 10.07% with $3,103/mo rent. Return on cash invested shows 26.41% in year one, and 5% annual appreciation builds toward $102,197 over five years. Five-year ROI reaches 138.26% and total cumulative return in cash records $169,534. Financing may use Ziffy Mortgage’s DSCR loan, which bases approval on $3,103/mo property income covering a $1,810/mo payment rather than investor’s personal income.
Single Family
Built in 1998
0.79 Acres lot
$N/A/sqft
No HOA
Neighborhood Data
Neighborhood data shown for ZIP Code: 49082, Quincy, MI area.
Housing Distribution
Housing Statistics
| Category | Value |
|---|---|
| Total HU (Housing Units) | 3,102 (100%) |
| Owner Occupied HU | 2,037 (65.7%) |
| Renter Occupied HU | 419 (13.5%) |
| Vacant Housing Units | 646 (20.8%) |
| Median Home Value | $194,318 |
| Average Home Value | $234,561 |
Housing Distribution
Address Breakdown
Residential
2,606
Single Family
2,532
Multi-Family
74
Businesses
129
Nearby investment properties with comparable rents
Nearby investment properties with comparable prices
