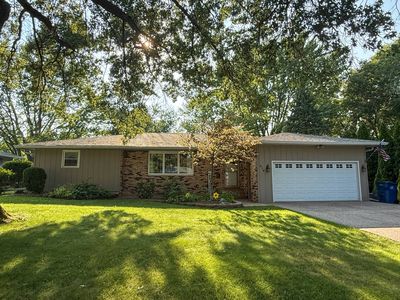
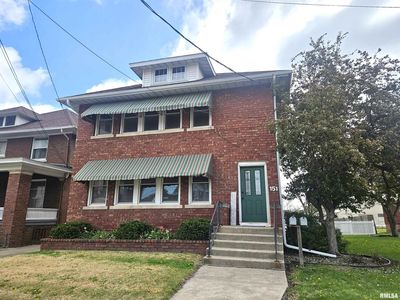
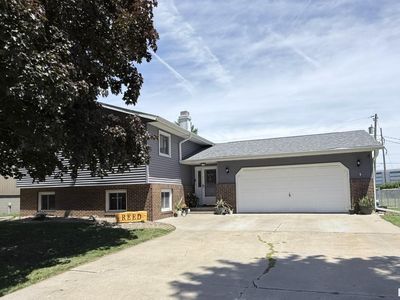
810 N 9th St #1/2MonmouthIL61462
INVESTMENT ANALYSIS
Investment Verdict
Steady Equity BuilderFor first-time U.S. investors or those diversifying conservatively, 810 N 9th St #1/2, Monmouth, IL, 61462 in Monmouth offers a clean, manageable entry. Rental yield 7.06%. DSCR 1.31 qualifies for Ziffy Mortgage's no-W2 mortgage for non-U.S. residents. Long-term: 5% annual appreciation projects $70,452 in additional property value over five years, with $2,349/yr in principal equity building ownership stake. Total projected cumulative return: $80,231.
| This Property | City Avg | |
|---|---|---|
| Gross Rental Yield | 7.1% | 7.0% |
| Monthly Cash Flow | $(269) | $900 |
City averages based on Monmouth market data in our database. Property projections are estimates.
DSCR Rental Loan Qualification
Qualifies using the property's rental income, not your personal income.
- ✓No W-2, pay stubs, or tax returns needed
- ✓Rental income qualifies you
- ✓Built for real estate investors
| Monthly Rental Income | $1,500 |
| Total Monthly Debt Service | $1,667 |
| DSCR Ratio | 0.90x |
Ziffy Mortgage typically prefers a DSCR of 1.0+, but in some cases you may qualify with a DSCR below 1. To explore if this deal qualifies for an investment mortgage, book time with your loan officer →
Estimates assume 6.0% rate / 30-yr fixed, 30% down, 1% tax, 0.5% insurance. Not a commitment to lend.
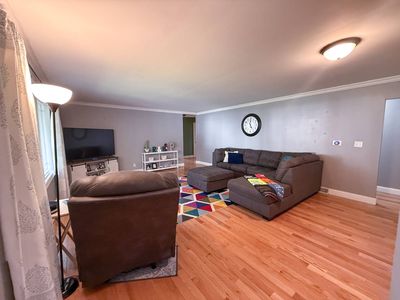
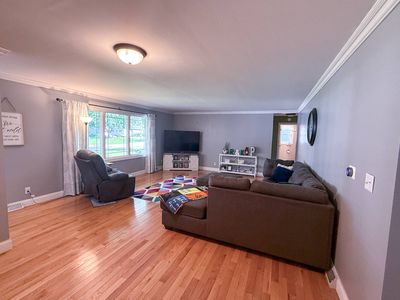
Single Family
Built in 1971
0.28 Acres lot
$N/A/sqft
No HOA
Neighborhood Data
Neighborhood data shown for ZIP Code: 61462, Monmouth, IL area.
Housing Distribution
Housing Statistics
| Category | Value |
|---|---|
| Total HU (Housing Units) | 4,818 (100%) |
| Owner Occupied HU | 3,039 (63.1%) |
| Renter Occupied HU | 1,128 (23.4%) |
| Vacant Housing Units | 651 (13.5%) |
| Median Home Value | $112,163 |
| Average Home Value | $161,049 |
Housing Distribution
Address Breakdown
Residential
4,397
Single Family
4,029
Multi-Family
368
Businesses
399


Nearby investment properties with comparable rents

Nearby investment properties with comparable prices


Ziffy AI Summary
A quick, investor-focused snapshot highlighting income strength, yield potential.
| Key metrics | Value |
|---|---|
| Price | $399,900 |
| Est. Rent | $3,200/mo |
| ROI | 18% |
- Attractive rent-to-price ratio for income stability
- Good fit for DSCR financing with healthy coverage
Single Family
Built in 1971
0.28 Acres lot
$N/A/sqft
No HOA
Neighborhood Data
Neighborhood data shown for ZIP Code: 61462, Monmouth, IL area.
Housing Distribution
Housing Statistics
| Category | Value |
|---|---|
| Total HU (Housing Units) | 4,818 (100%) |
| Owner Occupied HU | 3,039 (63.1%) |
| Renter Occupied HU | 1,128 (23.4%) |
| Vacant Housing Units | 651 (13.5%) |
| Median Home Value | $112,163 |
| Average Home Value | $161,049 |
Housing Distribution
Address Breakdown
Residential
4,397
Single Family
4,029
Multi-Family
368
Businesses
399
Nearby investment properties with comparable rents
Nearby investment properties with comparable prices