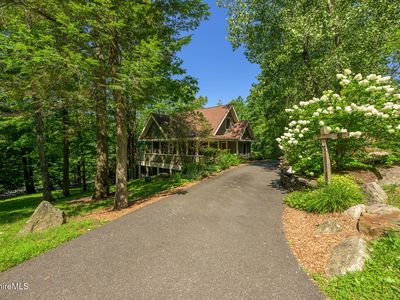
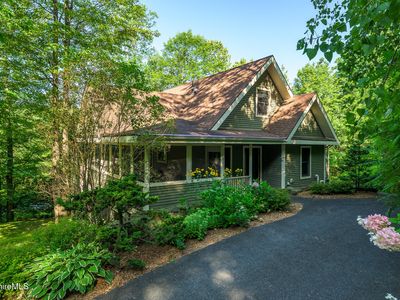
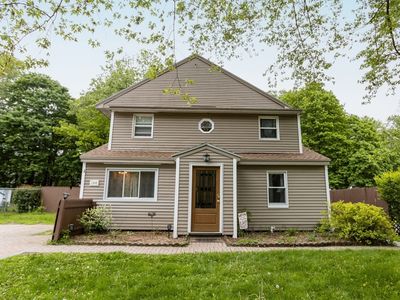
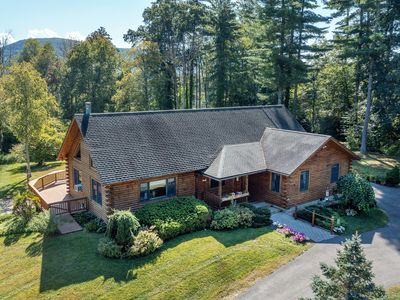
81 Chanterwood RdLeeMA01238
INVESTMENT ANALYSIS
Investment Verdict
Solid IncomeReliable, bankable, and well-priced, 81 Chanterwood Rd, Lee, MA, 01238 in Lee delivers $5,807/mo in gross rent and $796/mo in net monthly income at a $795,000 entry. The 8.76% yield and 1.62 DSCR make it a clean candidate for Ziffy Mortgage's DSCR loan; no W-2s or U.S. credit history required. With 5% annual appreciation projecting $219,644 over five years and $7,322/yr in equity from loan paydown, total projected return is $353,097.
| This Property | City Avg | |
|---|---|---|
| Gross Rental Yield | 8.8% | 5.5% |
| Monthly Cash Flow | $796 | $350 |
City averages based on Lee market data in our database. Property projections are estimates.
DSCR Loan Qualification
| Monthly Rental Income | $5,807 |
| Total Monthly Debt Service | $4,694 |
| DSCR Ratio | 1.24x |
Ziffy Mortgage: Your DSCR most likely meets our 1.0+ requirement, so you'll most probably qualify for our standard DSCR investment loan program. To pre-qualify, book time with your loan officer →
Estimates assume 6.0% rate / 30-yr fixed, 30% down, 1% tax, 0.5% insurance. Not a commitment to lend.
Single Family
Built in 2006
3.47 Acres lot
$N/A/sqft
No HOA
Neighborhood Data
Neighborhood data shown for ZIP Code: 01238, Lee, MA area.
Housing Distribution
Housing Statistics
| Category | Value |
|---|---|
| Total HU (Housing Units) | 3,318 (100%) |
| Owner Occupied HU | 1,798 (54.2%) |
| Renter Occupied HU | 851 (25.6%) |
| Vacant Housing Units | 669 (20.2%) |
| Median Home Value | $381,800 |
| Average Home Value | $497,269 |
Housing Distribution
Address Breakdown
Residential
2,726
Single Family
2,476
Multi-Family
250
Businesses
370


Nearby investment properties with comparable rents

Nearby investment properties with comparable prices

Ziffy AI Summary
A quick, investor-focused snapshot highlighting income strength, yield potential.
| Key metrics | Value |
|---|---|
| Price | $399,900 |
| Est. Rent | $3,200/mo |
| ROI | 18% |
- Attractive rent-to-price ratio for income stability
- Good fit for DSCR financing with healthy coverage
Single Family
Built in 2006
3.47 Acres lot
$N/A/sqft
No HOA
Neighborhood Data
Neighborhood data shown for ZIP Code: 01238, Lee, MA area.
Housing Distribution
Housing Statistics
| Category | Value |
|---|---|
| Total HU (Housing Units) | 3,318 (100%) |
| Owner Occupied HU | 1,798 (54.2%) |
| Renter Occupied HU | 851 (25.6%) |
| Vacant Housing Units | 669 (20.2%) |
| Median Home Value | $381,800 |
| Average Home Value | $497,269 |
Housing Distribution
Address Breakdown
Residential
2,726
Single Family
2,476
Multi-Family
250
Businesses
370
Nearby investment properties with comparable rents
Nearby investment properties with comparable prices
Listed by: Levin + Lazarus Team • COMPASS MASSACHUSETTS , LLC GB
Mls Name: BCMLS
Mls ID: #247366