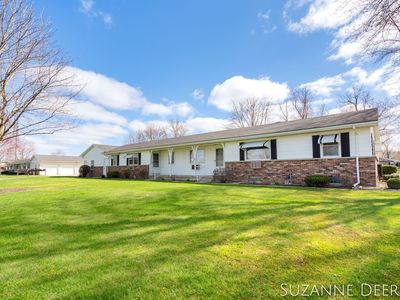
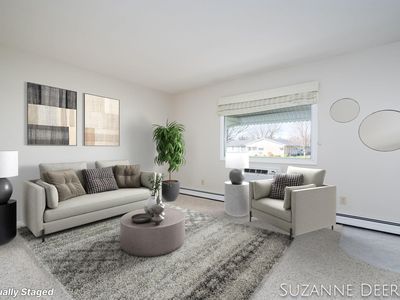
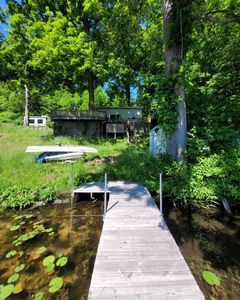
789 Andover St SEKentwoodMI49548


Nearby investment properties with comparable rents
Nearby investment properties with comparable prices

Ziffy AI Summary
A quick, investor-focused snapshot highlighting income strength, yield potential.
| Key metrics | Value |
|---|---|
| Price | $399,900 |
| Est. Rent | $3,200/mo |
| ROI | 18% |
- Attractive rent-to-price ratio for income stability
- Good fit for DSCR financing with healthy coverage
Investment Highlights
Rental property for sale in Kentwood at 789 Andover St SE, Kentwood, MI, 49548 priced at $158,500 pairs $1,424/mo rent with $89/mo cash flow after a $776/mo payment. Total monthly income equals $1,424/mo, and annual cash flow comes to $1,063/yr on $52,543 invested. Return on cash invested is 21.93% in year one, and rental yield stands at 10.78% on a $158,500 basis. Equity gained on principal adds $1,023/yr, and 5% annual appreciation accumulates to $43,791 by year five. Five-year ROI measures 116.66% and total cumulative return in cash reaches $61,295. For financing, Ziffy Mortgage’s DSCR program evaluates $1,424/mo property income against a $776/mo payment instead of your W2s, 1099s, or Tax returns.
Condo
Built in 1972
15.10 Acres lot
$N/A/sqft
$290 monthly HOA
Neighborhood Data
Neighborhood data shown for ZIP Code: 49548, Grand Rapids, MI area.
Housing Distribution
Housing Statistics
| Category | Value |
|---|---|
| Total HU (Housing Units) | 13,625 (100%) |
| Owner Occupied HU | 9,662 (70.9%) |
| Renter Occupied HU | 3,618 (26.6%) |
| Vacant Housing Units | 345 ( 2.5%) |
| Median Home Value | $202,210 |
| Average Home Value | $248,548 |
Housing Distribution
Address Breakdown
Residential
13,361
Single Family
12,642
Multi-Family
719
Businesses
1,284
Nearby investment properties with comparable rents
Nearby investment properties with comparable prices
