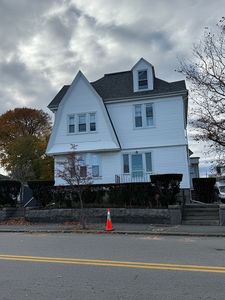
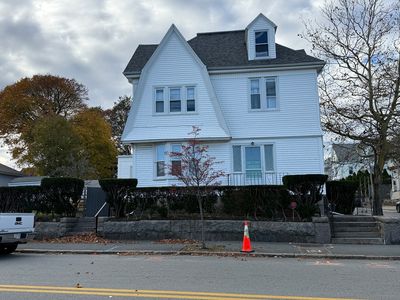
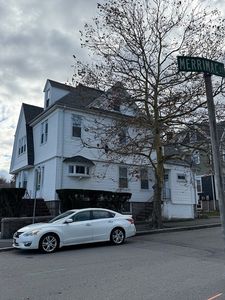
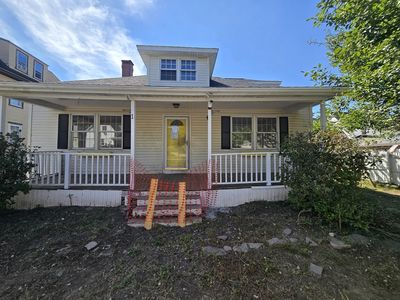
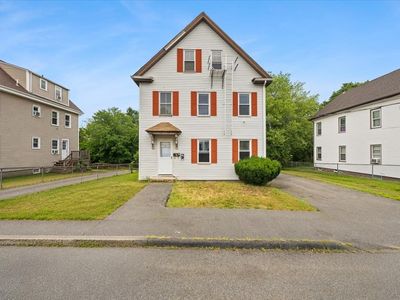
745 County StNew BedfordMA02740
INVESTMENT ANALYSIS
Investment Verdict
Appreciation PlayYield and appreciation often trade off, and at 745 County St, New Bedford, MA, 02740 in New Bedford the bet is firmly on appreciation. Rental yield 5.49%. The 5.49% gross yield on a $599,900 price is below income-first thresholds, but 5%/yr value growth projects $165,741 in equity by year five. Ziffy Mortgage's non-U.S. DSCR mortgage (1.02) finances the acquisition on rental income alone. A larger down payment (30–35%) reduces monthly debt service and tightens the spread. Total projected cumulative return: $160,980.
| This Property | City Avg | |
|---|---|---|
| Gross Rental Yield | 5.5% | 6.1% |
| Monthly Cash Flow | $(1,038) | $420 |
City averages based on New Bedford market data in our database. Property projections are estimates.
DSCR Rental Loan Qualification
Qualifies using the property's rental income, not your personal income.
- ✓No W-2, pay stubs, or tax returns needed
- ✓Rental income qualifies you
- ✓Built for real estate investors
| Monthly Rental Income | $2,743 |
| Total Monthly Debt Service | $3,542 |
| DSCR Ratio | 0.77x |
Ziffy Mortgage typically prefers a DSCR of 1.0+, but in some cases you may qualify with a DSCR below 1. To explore if this deal qualifies for an investment mortgage, book time with your loan officer →
Estimates assume 6.0% rate / 30-yr fixed, 30% down, 1% tax, 0.5% insurance. Not a commitment to lend.
Multi Family
Built in 1882
4,360 sqft lot
$N/A/sqft
No HOA
Neighborhood Data
Neighborhood data shown for ZIP Code: 02740, New Bedford, MA area.
Housing Distribution
Housing Statistics
| Category | Value |
|---|---|
| Total HU (Housing Units) | 21,079 (100%) |
| Owner Occupied HU | 7,962 (37.8%) |
| Renter Occupied HU | 11,861 (56.3%) |
| Vacant Housing Units | 1,256 ( 6.0%) |
| Median Home Value | $374,976 |
| Average Home Value | $421,127 |
Housing Distribution
Address Breakdown
Residential
16,625
Single Family
12,919
Multi-Family
3,706
Businesses
1,302


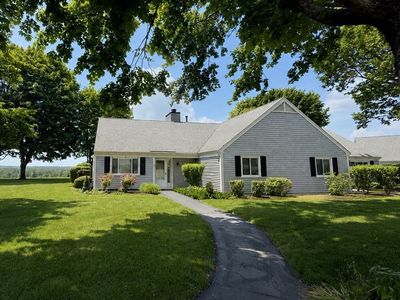
Nearby investment properties with comparable rents
Nearby investment properties with comparable prices


Ziffy AI Summary
A quick, investor-focused snapshot highlighting income strength, yield potential.
| Key metrics | Value |
|---|---|
| Price | $399,900 |
| Est. Rent | $3,200/mo |
| ROI | 18% |
- Attractive rent-to-price ratio for income stability
- Good fit for DSCR financing with healthy coverage
Multi Family
Built in 1882
4,360 sqft lot
$N/A/sqft
No HOA
Neighborhood Data
Neighborhood data shown for ZIP Code: 02740, New Bedford, MA area.
Housing Distribution
Housing Statistics
| Category | Value |
|---|---|
| Total HU (Housing Units) | 21,079 (100%) |
| Owner Occupied HU | 7,962 (37.8%) |
| Renter Occupied HU | 11,861 (56.3%) |
| Vacant Housing Units | 1,256 ( 6.0%) |
| Median Home Value | $374,976 |
| Average Home Value | $421,127 |
Housing Distribution
Address Breakdown
Residential
16,625
Single Family
12,919
Multi-Family
3,706
Businesses
1,302
Nearby investment properties with comparable rents
Nearby investment properties with comparable prices
Listed by: Guiomar Silveira • Gold Star Realty
Mls Name: MLS PIN
Mls ID: #73455686