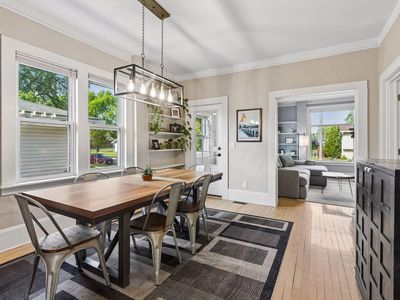
719 Quincy St NEMinneapolisMN55413


INVESTMENT ANALYSIS
Investment Verdict
Solid Income719 Quincy St NE, Minneapolis, MN, 55413 in Minneapolis earns a respectable 8.04% gross yield at $415,000, but after the $1,866/mo mortgage the net cash flow is $189/mo, a tight but positive spread. Expense discipline (vacancy, management, maintenance) will determine whether the margin widens. Ziffy Mortgage's DSCR mortgage (1.49) still qualifies on property income; a larger down payment can improve the cash-flow buffer. Long-term, 5% appreciation projects $114,657 over five years, making equity the dominant return driver. Total projected return: $169,599.
| This Property | City Avg | |
|---|---|---|
| Gross Rental Yield | 8% | 4.8% |
| Monthly Cash Flow | $189 | $850 |
City averages based on Minneapolis market data in our database. Property projections are estimates.
DSCR Rental Loan Qualification
Qualifies using the property's rental income, not your personal income.
- ✓No W-2, pay stubs, or tax returns needed
- ✓Rental income qualifies you
- ✓Built for real estate investors
| Monthly Rental Income | $2,780 |
| Total Monthly Debt Service | $2,426 |
| DSCR Ratio | 1.15x |
Ziffy Mortgage: Your DSCR most likely meets our 1.0+ requirement, so you'll most probably qualify for our standard DSCR investment loan program. To pre-qualify, book time with your loan officer →
Estimates assume 6.0% rate / 30-yr fixed, 30% down, 1% tax, 0.5% insurance. Not a commitment to lend.
Single Family
Built in 1900
5,227 sqft lot
$N/A/sqft
No HOA
Neighborhood Data
Neighborhood data shown for ZIP Code: 55413, Minneapolis, MN area.
Housing Distribution
Housing Statistics
| Category | Value |
|---|---|
| Total HU (Housing Units) | 8,900 (100%) |
| Owner Occupied HU | 2,427 (27.3%) |
| Renter Occupied HU | 5,696 (64.0%) |
| Vacant Housing Units | 777 ( 8.7%) |
| Median Home Value | $414,862 |
| Average Home Value | $485,616 |
Housing Distribution
Address Breakdown
Residential
8,225
Single Family
3,774
Multi-Family
4,451
Businesses
1,197


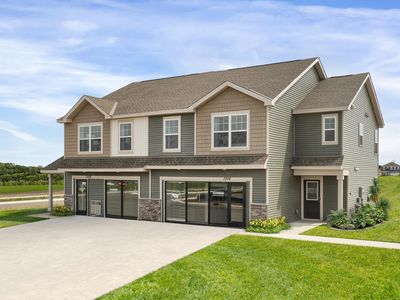
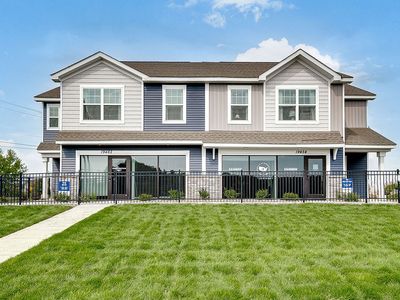
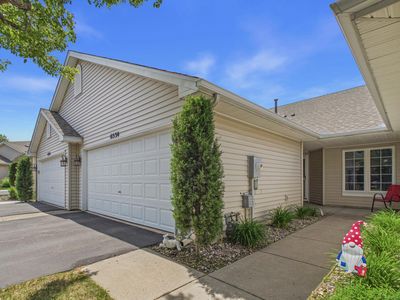
Nearby investment properties with comparable rents

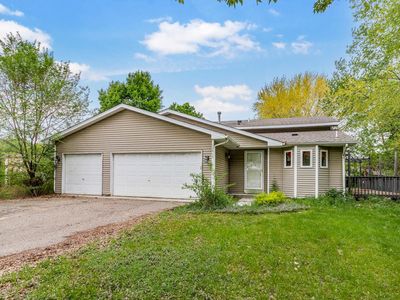

Nearby investment properties with comparable prices
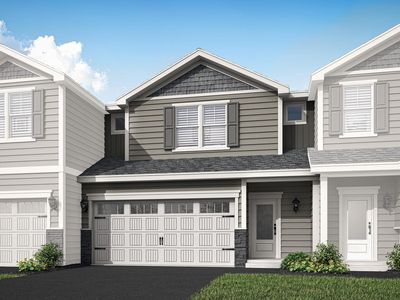

Ziffy AI Summary
A quick, investor-focused snapshot highlighting income strength, yield potential.
| Key metrics | Value |
|---|---|
| Price | $399,900 |
| Est. Rent | $3,200/mo |
| ROI | 18% |
- Attractive rent-to-price ratio for income stability
- Good fit for DSCR financing with healthy coverage
Single Family
Built in 1900
5,227 sqft lot
$N/A/sqft
No HOA
Neighborhood Data
Neighborhood data shown for ZIP Code: 55413, Minneapolis, MN area.
Housing Distribution
Housing Statistics
| Category | Value |
|---|---|
| Total HU (Housing Units) | 8,900 (100%) |
| Owner Occupied HU | 2,427 (27.3%) |
| Renter Occupied HU | 5,696 (64.0%) |
| Vacant Housing Units | 777 ( 8.7%) |
| Median Home Value | $414,862 |
| Average Home Value | $485,616 |
Housing Distribution
Address Breakdown
Residential
8,225
Single Family
3,774
Multi-Family
4,451
Businesses
1,197
Nearby investment properties with comparable rents
Nearby investment properties with comparable prices
Listed by: N/A • N/A
Mls Name: NorthstarMLS as distributed by MLS GRID
Mls ID: #7076806