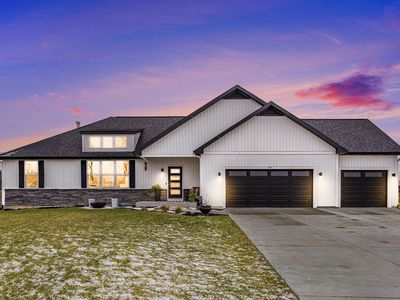
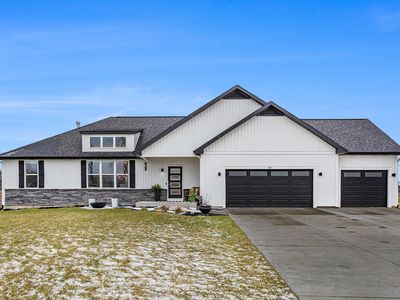
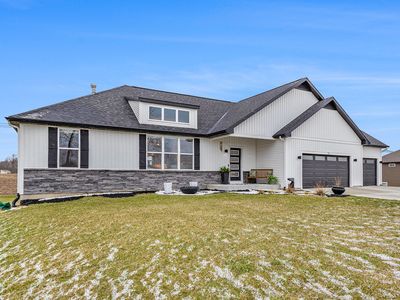
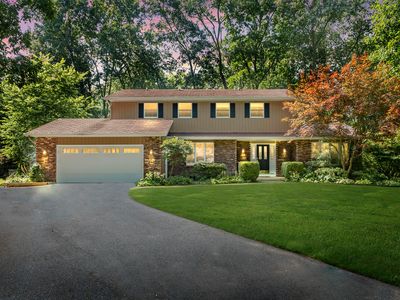
7115 N 28th StRichlandMI49083


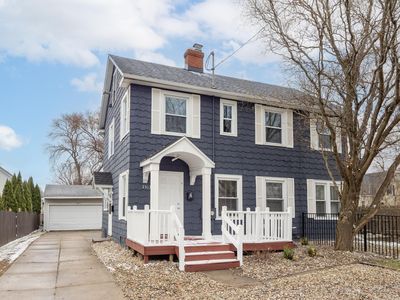
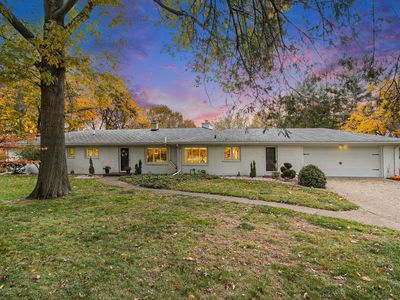
Nearby investment properties with comparable rents

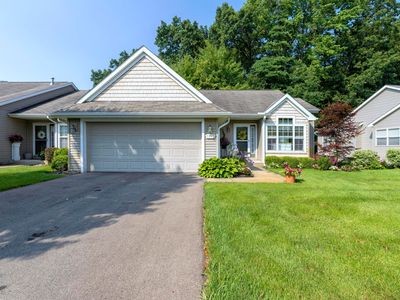
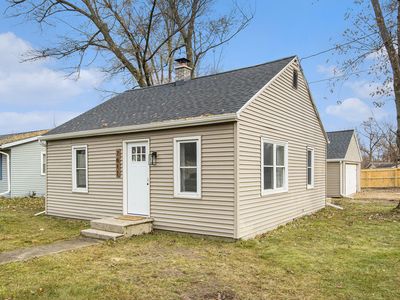
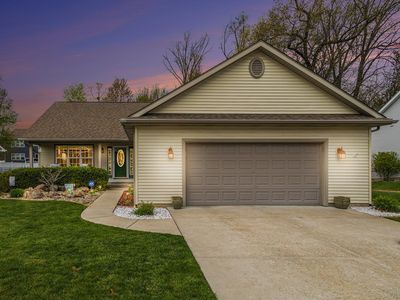
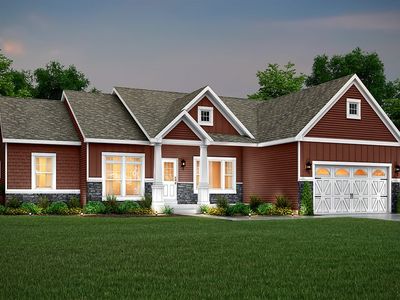
Nearby investment properties with comparable prices

Ziffy AI Summary
A quick, investor-focused snapshot highlighting income strength, yield potential.
| Key metrics | Value |
|---|---|
| Price | $399,900 |
| Est. Rent | $3,200/mo |
| ROI | 18% |
- Attractive rent-to-price ratio for income stability
- Good fit for DSCR financing with healthy coverage
Investment Highlights
Total monthly income runs $2,437/mo, and a $2,691/mo payment. Purchase price stands at $549,900, and rental yield measures 5.32% with $2,437/mo rent. Return on cash invested shows 12.17% in year one, and 5% annual appreciation builds toward $151,927 over five years. Five-year ROI reaches 61.89% and total cumulative return in cash records $111,974. Financing may use Ziffy Mortgage’s DSCR loan, which bases approval on $2,437/mo property income covering a $2,691/mo payment rather than investor’s personal income.
Single Family
Built in 2022
1.01 Acres lot
$N/A/sqft
No HOA
Neighborhood Data
Neighborhood data shown for ZIP Code: 49083, Richland, MI area.
Housing Distribution
Housing Statistics
| Category | Value |
|---|---|
| Total HU (Housing Units) | 3,673 (100%) |
| Owner Occupied HU | 2,924 (79.6%) |
| Renter Occupied HU | 443 (12.1%) |
| Vacant Housing Units | 306 ( 8.3%) |
| Median Home Value | $365,950 |
| Average Home Value | $516,858 |
Housing Distribution
Address Breakdown
Residential
3,380
Single Family
3,296
Multi-Family
84
Businesses
281
Nearby investment properties with comparable rents
Nearby investment properties with comparable prices
