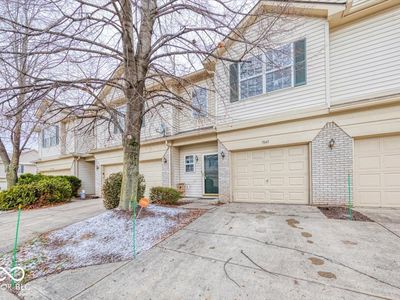
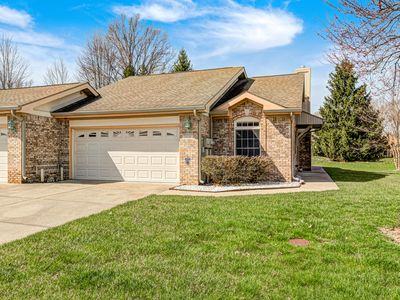
7045 Gavin DrIndianapolisIN46217
INVESTMENT ANALYSIS
Investment Verdict
Solid IncomeTight but positive: 7045 Gavin Dr, Indianapolis, IN, 46217 in Indianapolis at $174,900 earns $1,378/mo in rent and nets $33/mo after the $786/mo payment, a 9.45% yield with limited short-term income headroom. The equity story offsets the thin monthly spread: 5% annual appreciation adds $48,322 over five years. Ziffy Mortgage underwrites this on a 1.75 DSCR without U.S. credit history. With $1,611/yr in principal paydown, total projected return reaches $87,361.
| This Property | City Avg | |
|---|---|---|
| Gross Rental Yield | 9.5% | 6.8% |
| Monthly Cash Flow | $33 | $450 |
City averages based on Indianapolis market data in our database. Property projections are estimates.
DSCR Loan Qualification
| Monthly Rental Income | $1,378 |
| Total Monthly Debt Service | $980 |
| DSCR Ratio | 1.41x |
Ziffy Mortgage: Your DSCR most likely meets our 1.0+ requirement, so you'll most probably qualify for our standard DSCR investment loan program. To pre-qualify, book time with your loan officer →
Estimates assume 6.0% rate / 30-yr fixed, 30% down, 1% tax, 0.5% insurance. Not a commitment to lend.
Condo
Built in 2001
871.20 sqft lot
$N/A/sqft
No HOA
Neighborhood Data
Neighborhood data shown for ZIP Code: 46217, Indianapolis, IN area.
Housing Distribution
Housing Statistics
| Category | Value |
|---|---|
| Total HU (Housing Units) | 13,196 (100%) |
| Owner Occupied HU | 9,776 (74.1%) |
| Renter Occupied HU | 2,911 (22.1%) |
| Vacant Housing Units | 509 ( 3.9%) |
| Median Home Value | $270,235 |
| Average Home Value | $283,488 |
Housing Distribution
Address Breakdown
Residential
13,204
Single Family
11,627
Multi-Family
1,577
Businesses
676


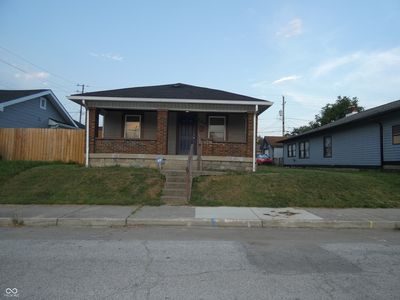
Nearby investment properties with comparable rents
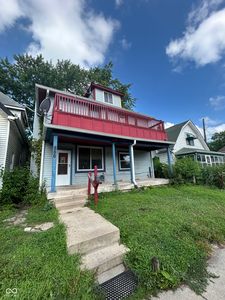
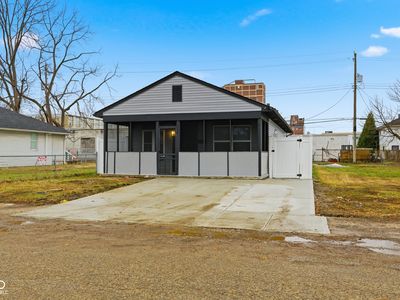
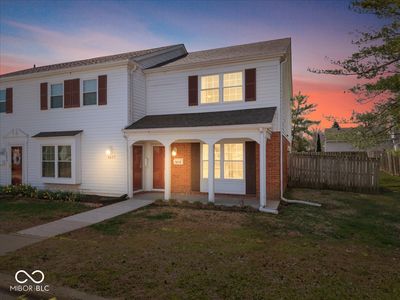
Nearby investment properties with comparable prices

Ziffy AI Summary
A quick, investor-focused snapshot highlighting income strength, yield potential.
| Key metrics | Value |
|---|---|
| Price | $399,900 |
| Est. Rent | $3,200/mo |
| ROI | 18% |
- Attractive rent-to-price ratio for income stability
- Good fit for DSCR financing with healthy coverage
Condo
Built in 2001
871.20 sqft lot
$N/A/sqft
No HOA
Neighborhood Data
Neighborhood data shown for ZIP Code: 46217, Indianapolis, IN area.
Housing Distribution
Housing Statistics
| Category | Value |
|---|---|
| Total HU (Housing Units) | 13,196 (100%) |
| Owner Occupied HU | 9,776 (74.1%) |
| Renter Occupied HU | 2,911 (22.1%) |
| Vacant Housing Units | 509 ( 3.9%) |
| Median Home Value | $270,235 |
| Average Home Value | $283,488 |
Housing Distribution
Address Breakdown
Residential
13,204
Single Family
11,627
Multi-Family
1,577
Businesses
676
Nearby investment properties with comparable rents
Nearby investment properties with comparable prices
Listed by: Dylan Pettijohn • Real Broker, LLC
Mls Name: MIBOR as distributed by MLS GRID
Mls ID: #22077459