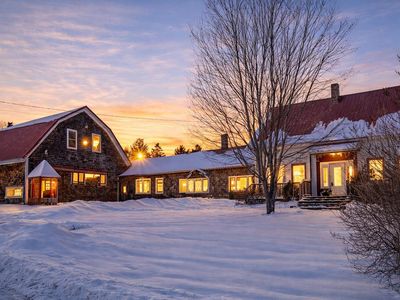
69 N Horse Back RoadBurnhamME04922
INVESTMENT ANALYSIS
Investment Verdict
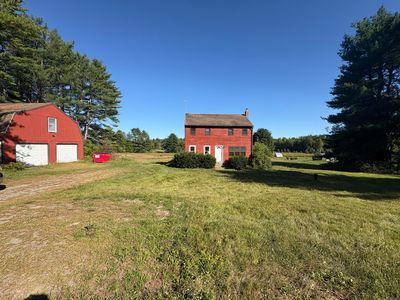
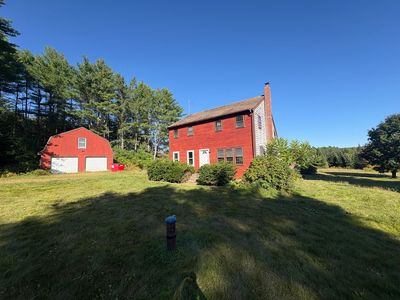
Appreciation PlayInvestors who prioritise long-run asset value over immediate income should consider 69 N Horse Back Road, Burnham, ME, 04922 in Burnham. Rental yield 0%. At $269,000 with 0% gross yield, current distributions are modest, but the 5% appreciation rate projects $74,320 in new equity by year five, complemented by $2,478/yr in principal paydown. Ziffy Mortgage's DSCR loan (0.00) allows non-U.S. residents to acquire without W-2s or domestic credit.
| This Property | City Avg | |
|---|---|---|
| Gross Rental Yield | 0% | 8.5% |
| Monthly Cash Flow | $0 | $500 |
City averages based on Burnham market data in our database. Property projections are estimates.
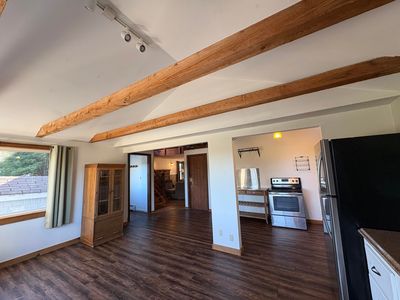
Single Family
Built in 1978
8 Acres lot
$N/A/sqft
No HOA
Neighborhood Data
Neighborhood data shown for ZIP Code: 04922, Burnham, ME area.
Housing Distribution
Housing Statistics
| Category | Value |
|---|---|
| Total HU (Housing Units) | 694 (100%) |
| Owner Occupied HU | 421 (60.7%) |
| Renter Occupied HU | 68 ( 9.8%) |
| Vacant Housing Units | 205 (29.5%) |
| Median Home Value | $224,583 |
| Average Home Value | $278,420 |
Housing Distribution
Address Breakdown
Residential
562
Single Family
562
Multi-Family
0
Businesses
10


Nearby investment properties with comparable rents
No similar rental properties found nearby.
Nearby investment properties with comparable prices
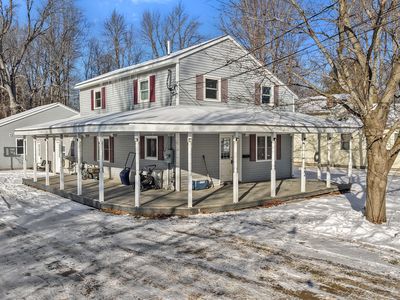

Ziffy AI Summary
A quick, investor-focused snapshot highlighting income strength, yield potential.
| Key metrics | Value |
|---|---|
| Price | $399,900 |
| Est. Rent | $3,200/mo |
| ROI | 18% |
- Attractive rent-to-price ratio for income stability
- Good fit for DSCR financing with healthy coverage
Single Family
Built in 1978
8 Acres lot
$N/A/sqft
No HOA
Neighborhood Data
Neighborhood data shown for ZIP Code: 04922, Burnham, ME area.
Housing Distribution
Housing Statistics
| Category | Value |
|---|---|
| Total HU (Housing Units) | 694 (100%) |
| Owner Occupied HU | 421 (60.7%) |
| Renter Occupied HU | 68 ( 9.8%) |
| Vacant Housing Units | 205 (29.5%) |
| Median Home Value | $224,583 |
| Average Home Value | $278,420 |
Housing Distribution
Address Breakdown
Residential
562
Single Family
562
Multi-Family
0
Businesses
10
Nearby investment properties with comparable rents
No similar rental properties found nearby.
Nearby investment properties with comparable prices