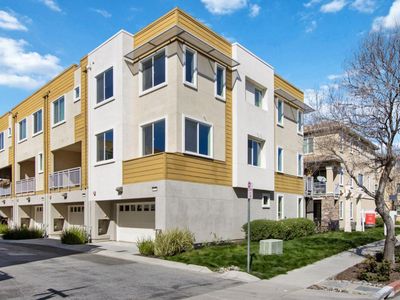
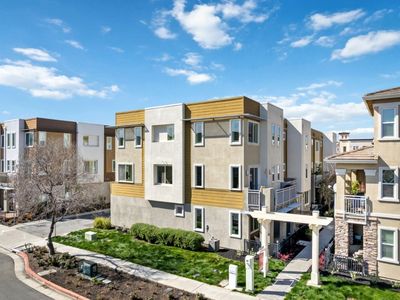
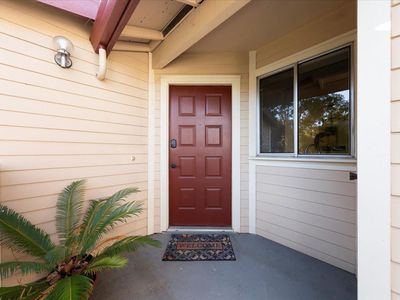
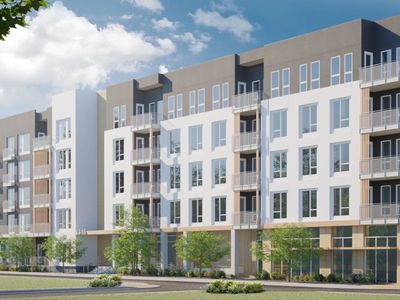
675 Tigerseye LoopSan JoseCA95123
INVESTMENT ANALYSIS
Investment Verdict
Appreciation PlayNot all U.S. investment properties are valued for current income. 675 Tigerseye Loop, San Jose, CA, 95123 in San Jose at $1,250,000, 3.72% gross yield, is a market-growth asset. Rental yield 3.72%. The $3,877/mo rent partially funds the $5,621/mo debt service; the core return is the 5%/yr price growth projected to add $345,352 over five years. Ziffy Mortgage's DSCR mortgage (0.69) provides financing for foreign nationals without domestic income checks. A 30–35% down payment often produces the cleanest coverage for low-yield properties. Total five-year return: $225,847.
| This Property | City Avg | |
|---|---|---|
| Gross Rental Yield | 3.7% | 6.0% |
| Monthly Cash Flow | $(4,310) | $500 |
City averages based on San Jose market data in our database. Property projections are estimates.
DSCR Loan Qualification
| Monthly Rental Income | $3,877 |
| Total Monthly Debt Service | $7,235 |
| DSCR Ratio | 0.54x |
Ziffy Mortgage typically prefers a DSCR of 1.0+, but in some cases you may qualify with a DSCR below 1. To explore if this deal qualifies for an investment mortgage, book time with your loan officer →
Estimates assume 6.0% rate / 30-yr fixed, 30% down, 1% tax, 0.5% insurance. Not a commitment to lend.
Townhouse
Built in 2014
1,451 sqft lot
$N/A/sqft
No HOA
Neighborhood Data
Neighborhood data shown for ZIP Code: 95123, San Jose, CA area.
Housing Distribution
Housing Statistics
| Category | Value |
|---|---|
| Total HU (Housing Units) | 24,587 (100%) |
| Owner Occupied HU | 14,216 (57.8%) |
| Renter Occupied HU | 9,594 (39.0%) |
| Vacant Housing Units | 777 ( 3.2%) |
| Median Home Value | $1,169,061 |
| Average Home Value | $1,179,482 |
Housing Distribution
Address Breakdown
Residential
24,862
Single Family
20,176
Multi-Family
4,686
Businesses
950


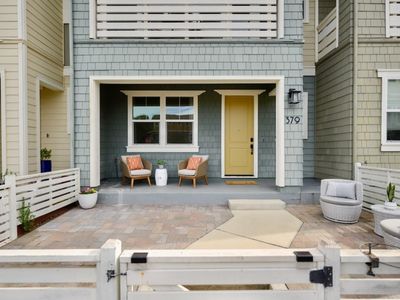
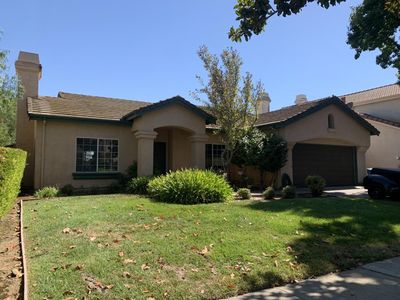
Nearby investment properties with comparable rents

Nearby investment properties with comparable prices


Ziffy AI Summary
A quick, investor-focused snapshot highlighting income strength, yield potential.
| Key metrics | Value |
|---|---|
| Price | $399,900 |
| Est. Rent | $3,200/mo |
| ROI | 18% |
- Attractive rent-to-price ratio for income stability
- Good fit for DSCR financing with healthy coverage
Townhouse
Built in 2014
1,451 sqft lot
$N/A/sqft
No HOA
Neighborhood Data
Neighborhood data shown for ZIP Code: 95123, San Jose, CA area.
Housing Distribution
Housing Statistics
| Category | Value |
|---|---|
| Total HU (Housing Units) | 24,587 (100%) |
| Owner Occupied HU | 14,216 (57.8%) |
| Renter Occupied HU | 9,594 (39.0%) |
| Vacant Housing Units | 777 ( 3.2%) |
| Median Home Value | $1,169,061 |
| Average Home Value | $1,179,482 |
Housing Distribution
Address Breakdown
Residential
24,862
Single Family
20,176
Multi-Family
4,686
Businesses
950
Nearby investment properties with comparable rents
Nearby investment properties with comparable prices
Listed by: N/A • N/A
Mls Name: MLSListings Inc
Mls ID: #ML82035315