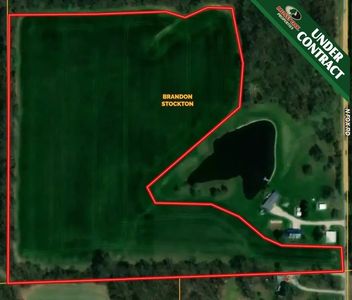
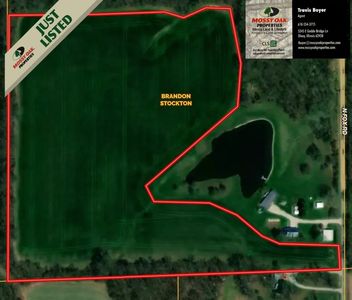
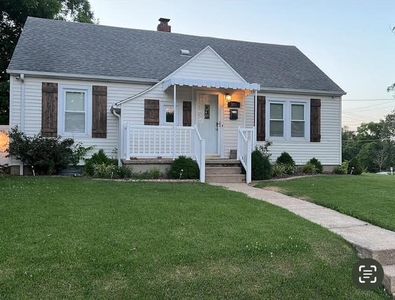
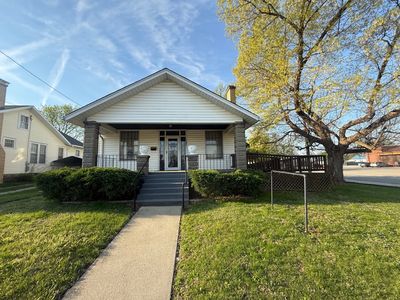
6115 N Fox RdOlneyIL62450
INVESTMENT ANALYSIS
Investment Verdict
Strong Cash FlowThis Olney rental at 6115 N Fox Rd, Olney, IL, 62450 sits in the solid-income band: 11.78% gross yield, $1,422/mo rent, $418/mo net after the $651/mo debt service, DSCR 2.18. Entry price of $144,800 is well-calibrated for the income it produces. Ziffy Mortgage finances this type of asset on rental income alone, no tax returns, no U.S. credit profile. Projected five-year appreciation of $40,006 and $1,334/yr in principal reduction bring total cumulative return to $82,301.
| This Property | City Avg | |
|---|---|---|
| Gross Rental Yield | 11.8% | 7.0% |
| Monthly Cash Flow | $418 | $150 |
City averages based on Olney market data in our database. Property projections are estimates.
DSCR Rental Loan Qualification
Qualifies using the property's rental income, not your personal income.
- ✓No W-2, pay stubs, or tax returns needed
- ✓Rental income qualifies you
- ✓Built for real estate investors
| Monthly Rental Income | $1,422 |
| Total Monthly Debt Service | $947 |
| DSCR Ratio | 1.50x |
Ziffy Mortgage: Your DSCR most likely meets our 1.0+ requirement, so you'll most probably qualify for our standard DSCR investment loan program. To pre-qualify, book time with your loan officer →
Estimates assume 6.0% rate / 30-yr fixed, 30% down, 1% tax, 0.5% insurance. Not a commitment to lend.
Single Family
Built in N/A
20.30 Acres lot
$N/A/sqft
No HOA
Neighborhood Data
Neighborhood data shown for ZIP Code: 62450, Olney, IL area.
Housing Distribution
Housing Statistics
| Category | Value |
|---|---|
| Total HU (Housing Units) | 5,685 (100%) |
| Owner Occupied HU | 3,543 (62.3%) |
| Renter Occupied HU | 1,489 (26.2%) |
| Vacant Housing Units | 653 (11.5%) |
| Median Home Value | $140,262 |
| Average Home Value | $187,316 |
Housing Distribution
Address Breakdown
Residential
5,301
Single Family
5,087
Multi-Family
214
Businesses
558


Nearby investment properties with comparable rents
Nearby investment properties with comparable prices


Ziffy AI Summary
A quick, investor-focused snapshot highlighting income strength, yield potential.
| Key metrics | Value |
|---|---|
| Price | $399,900 |
| Est. Rent | $3,200/mo |
| ROI | 18% |
- Attractive rent-to-price ratio for income stability
- Good fit for DSCR financing with healthy coverage
Single Family
Built in N/A
20.30 Acres lot
$N/A/sqft
No HOA
Neighborhood Data
Neighborhood data shown for ZIP Code: 62450, Olney, IL area.
Housing Distribution
Housing Statistics
| Category | Value |
|---|---|
| Total HU (Housing Units) | 5,685 (100%) |
| Owner Occupied HU | 3,543 (62.3%) |
| Renter Occupied HU | 1,489 (26.2%) |
| Vacant Housing Units | 653 (11.5%) |
| Median Home Value | $140,262 |
| Average Home Value | $187,316 |
Housing Distribution
Address Breakdown
Residential
5,301
Single Family
5,087
Multi-Family
214
Businesses
558
Nearby investment properties with comparable rents
Nearby investment properties with comparable prices