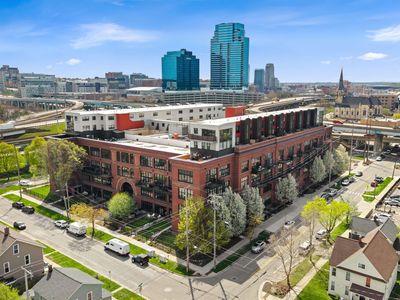
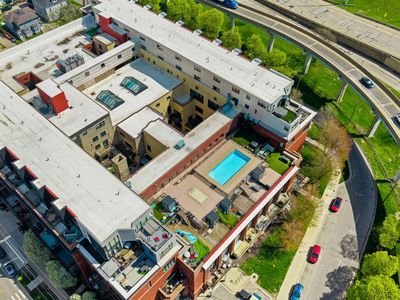
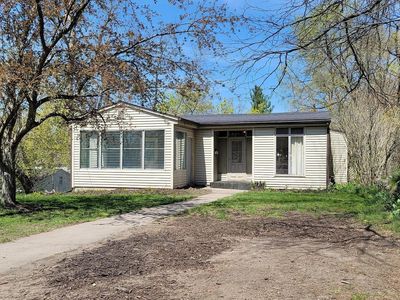
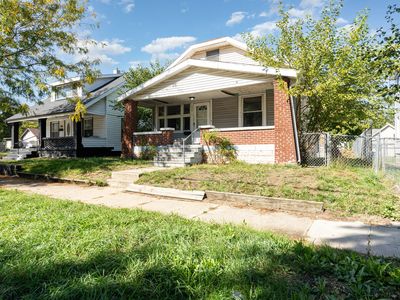
600 Broadway Ave NW APT 203Grand RapidsMI49504

INVESTMENT ANALYSIS
Investment Verdict
Strong Cash FlowThe cash-flow margin at 600 Broadway Ave NW APT 203, Grand Rapids, MI, 49504 in Grand Rapids is narrow, $173/mo net on $2,084/mo rent after the $1,012/mo debt service, but the property operates at break-even-plus, not a loss. At $225,000 with a 11.12% yield, the long-run equity case via 5% appreciation ($62,163 over five years) and $2,072/yr in principal paydown is where the returns accumulate. Ziffy Mortgage's 2.06 DSCR loan requires no W-2s or U.S. credit. Total projected cumulative return: $98,664.
| This Property | City Avg | |
|---|---|---|
| Gross Rental Yield | 11.1% | 6.8% |
| Monthly Cash Flow | $173 | $850 |
City averages based on Grand Rapids market data in our database. Property projections are estimates.
DSCR Rental Loan Qualification
Qualifies using the property's rental income, not your personal income.
- ✓No W-2, pay stubs, or tax returns needed
- ✓Rental income qualifies you
- ✓Built for real estate investors
| Monthly Rental Income | $2,084 |
| Total Monthly Debt Service | $1,822 |
| DSCR Ratio | 1.14x |
Ziffy Mortgage: Your DSCR most likely meets our 1.0+ requirement, so you'll most probably qualify for our standard DSCR investment loan program. To pre-qualify, book time with your loan officer →
Estimates assume 6.0% rate / 30-yr fixed, 30% down, 1% tax, 0.5% insurance. Not a commitment to lend.
Condo
Built in 1900
N/A lot
$N/A/sqft
$428 monthly HOA
Neighborhood Data
Neighborhood data shown for ZIP Code: 49504, Grand Rapids, MI area.
Housing Distribution
Housing Statistics
| Category | Value |
|---|---|
| Total HU (Housing Units) | 18,664 (100%) |
| Owner Occupied HU | 10,506 (56.3%) |
| Renter Occupied HU | 7,008 (37.5%) |
| Vacant Housing Units | 1,150 ( 6.2%) |
| Median Home Value | $258,759 |
| Average Home Value | $284,959 |
Housing Distribution
Address Breakdown
Residential
17,332
Single Family
14,985
Multi-Family
2,347
Businesses
891


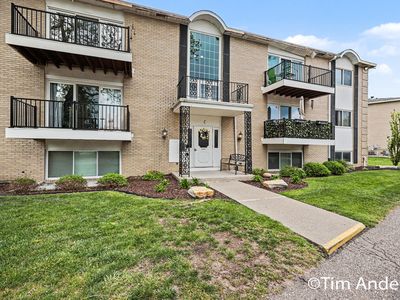
Nearby investment properties with comparable rents
Nearby investment properties with comparable prices

Ziffy AI Summary
A quick, investor-focused snapshot highlighting income strength, yield potential.
| Key metrics | Value |
|---|---|
| Price | $399,900 |
| Est. Rent | $3,200/mo |
| ROI | 18% |
- Attractive rent-to-price ratio for income stability
- Good fit for DSCR financing with healthy coverage
Condo
Built in 1900
N/A lot
$N/A/sqft
$428 monthly HOA
Neighborhood Data
Neighborhood data shown for ZIP Code: 49504, Grand Rapids, MI area.
Housing Distribution
Housing Statistics
| Category | Value |
|---|---|
| Total HU (Housing Units) | 18,664 (100%) |
| Owner Occupied HU | 10,506 (56.3%) |
| Renter Occupied HU | 7,008 (37.5%) |
| Vacant Housing Units | 1,150 ( 6.2%) |
| Median Home Value | $258,759 |
| Average Home Value | $284,959 |
Housing Distribution
Address Breakdown
Residential
17,332
Single Family
14,985
Multi-Family
2,347
Businesses
891
Nearby investment properties with comparable rents
Nearby investment properties with comparable prices
Listed by: Jessica R Walter • EXP Realty LLC
Mls Name: MichRIC
Mls Provider:
Mls ID: #26017365
Disclaimer: Information is deemed reliable but not guaranteed. Copyright 2026 MichRIC, LLC. All rights reserved.