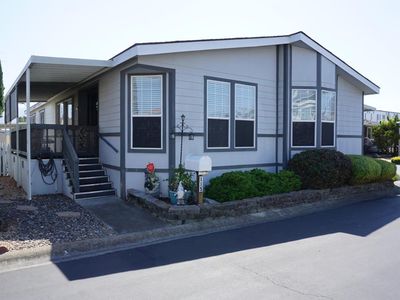
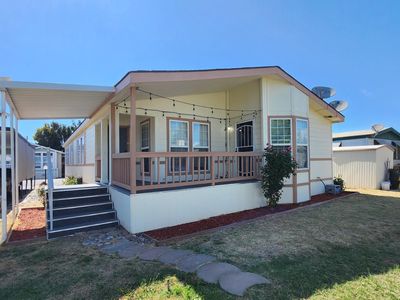
5770 Winfield Blvd SPC 115San JoseCA95123
INVESTMENT ANALYSIS
Investment Verdict
Strong Cash FlowThe yield at 5770 Winfield Blvd SPC 115, San Jose, CA, 95123 in San Jose speaks for itself: 16.59% gross on a $475,000 price, generating $6,569/mo in rent and $3,630/mo in net income after the $2,136/mo debt service. DSCR 3.08, a wide margin that supports Ziffy Mortgage's DSCR loan without any personal income check. Annual cash flow of $43,564 stacks alongside $131,234 in projected five-year appreciation and $4,375/yr in principal reduction. Projected total cumulative return: $413,750.
| This Property | City Avg | |
|---|---|---|
| Gross Rental Yield | 16.6% | 6.0% |
| Monthly Cash Flow | $3,630 | $500 |
City averages based on San Jose market data in our database. Property projections are estimates.
DSCR Loan Qualification
| Monthly Rental Income | $6,569 |
| Total Monthly Debt Service | $2,749 |
| DSCR Ratio | 2.39x |
Ziffy Mortgage: Your DSCR most likely meets our 1.0+ requirement, so you'll most probably qualify for our standard DSCR investment loan program. To pre-qualify, book time with your loan officer →
Estimates assume 6.0% rate / 30-yr fixed, 30% down, 1% tax, 0.5% insurance. Not a commitment to lend.
Manufactured
Built in 2002
N/A lot
$N/A/sqft
No HOA
Neighborhood Data
Neighborhood data shown for ZIP Code: 95123, San Jose, CA area.
Housing Distribution
Housing Statistics
| Category | Value |
|---|---|
| Total HU (Housing Units) | 24,587 (100%) |
| Owner Occupied HU | 14,216 (57.8%) |
| Renter Occupied HU | 9,594 (39.0%) |
| Vacant Housing Units | 777 ( 3.2%) |
| Median Home Value | $1,169,061 |
| Average Home Value | $1,179,482 |
Housing Distribution
Address Breakdown
Residential
24,862
Single Family
20,176
Multi-Family
4,686
Businesses
950


Nearby investment properties with comparable rents
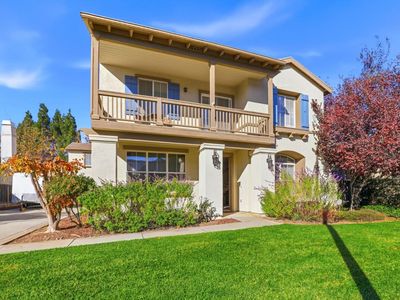
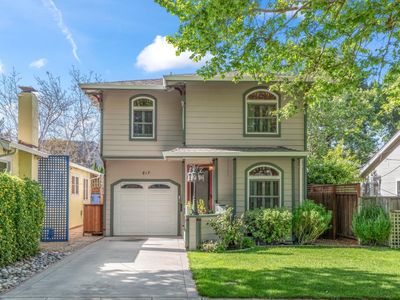
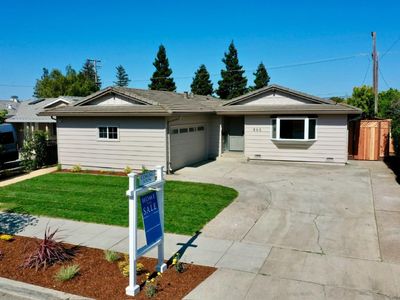
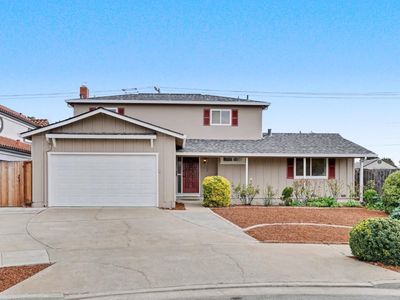
Nearby investment properties with comparable prices

Ziffy AI Summary
A quick, investor-focused snapshot highlighting income strength, yield potential.
| Key metrics | Value |
|---|---|
| Price | $399,900 |
| Est. Rent | $3,200/mo |
| ROI | 18% |
- Attractive rent-to-price ratio for income stability
- Good fit for DSCR financing with healthy coverage
Manufactured
Built in 2002
N/A lot
$N/A/sqft
No HOA
Neighborhood Data
Neighborhood data shown for ZIP Code: 95123, San Jose, CA area.
Housing Distribution
Housing Statistics
| Category | Value |
|---|---|
| Total HU (Housing Units) | 24,587 (100%) |
| Owner Occupied HU | 14,216 (57.8%) |
| Renter Occupied HU | 9,594 (39.0%) |
| Vacant Housing Units | 777 ( 3.2%) |
| Median Home Value | $1,169,061 |
| Average Home Value | $1,179,482 |
Housing Distribution
Address Breakdown
Residential
24,862
Single Family
20,176
Multi-Family
4,686
Businesses
950
Nearby investment properties with comparable rents
Nearby investment properties with comparable prices