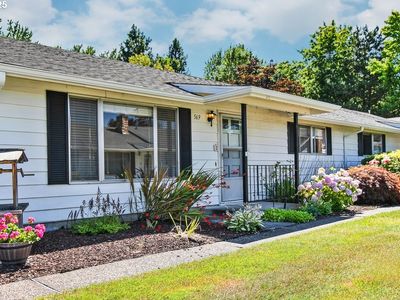
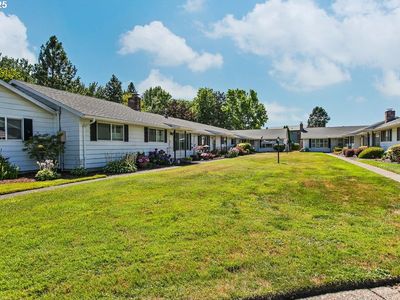
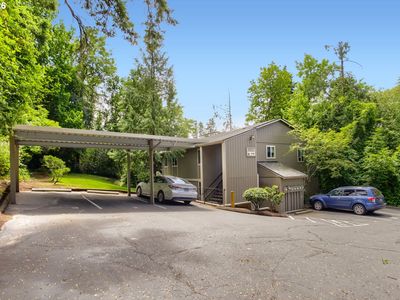
569 NE Fleming AveGreshamOR97030
INVESTMENT ANALYSIS
Investment Verdict
Strong Cash Flow569 NE Fleming Ave, Gresham, OR, 97030 in Gresham is a top-tier cash-flow asset. At $225,000 it produces $1,962/mo in rent and $604/mo in net monthly income, a 10.46% gross rental yield. The DSCR of 1.94 qualifies for Ziffy Mortgage's DSCR loan without W-2s or U.S. credit history. Annual cash flow: $7,246. Five-year appreciation adds $62,163, driving a total cumulative return of $124,056.
| This Property | City Avg | |
|---|---|---|
| Gross Rental Yield | 10.5% | 5.8% |
| Monthly Cash Flow | $604 | $420 |
City averages based on Gresham market data in our database. Property projections are estimates.
DSCR Rental Loan Qualification
Qualifies using the property's rental income, not your personal income.
- ✓No W-2, pay stubs, or tax returns needed
- ✓Rental income qualifies you
- ✓Built for real estate investors
| Monthly Rental Income | $1,962 |
| Total Monthly Debt Service | $1,269 |
| DSCR Ratio | 1.55x |
Ziffy Mortgage: Your DSCR most likely meets our 1.0+ requirement, so you'll most probably qualify for our standard DSCR investment loan program. To pre-qualify, book time with your loan officer →
Estimates assume 6.0% rate / 30-yr fixed, 30% down, 1% tax, 0.5% insurance. Not a commitment to lend.
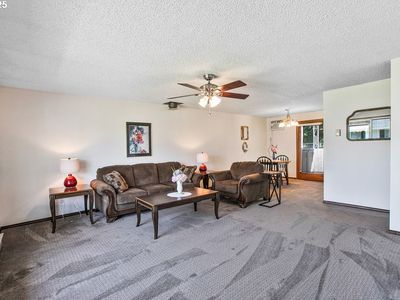
Condo
Built in 1974
N/A lot
$N/A/sqft
No HOA
Neighborhood Data
Neighborhood data shown for ZIP Code: 97030, Gresham, OR area.
Housing Distribution
Housing Statistics
| Category | Value |
|---|---|
| Total HU (Housing Units) | 15,767 (100%) |
| Owner Occupied HU | 6,647 (42.2%) |
| Renter Occupied HU | 8,289 (52.6%) |
| Vacant Housing Units | 831 ( 5.3%) |
| Median Home Value | $454,651 |
| Average Home Value | $507,729 |
Housing Distribution
Address Breakdown
Residential
15,955
Single Family
12,318
Multi-Family
3,637
Businesses
1,735


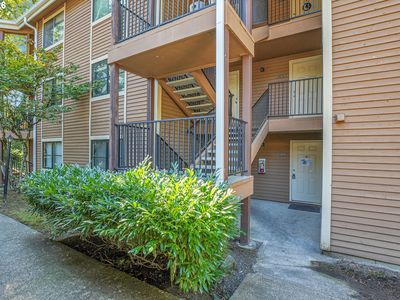
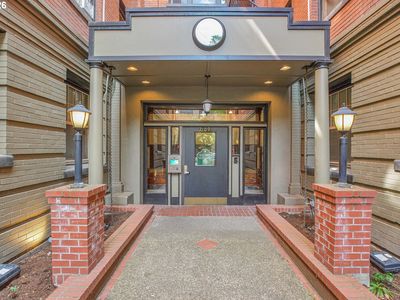
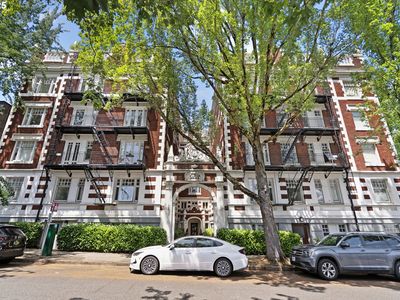
Nearby investment properties with comparable rents

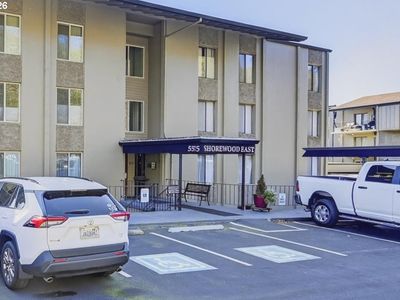
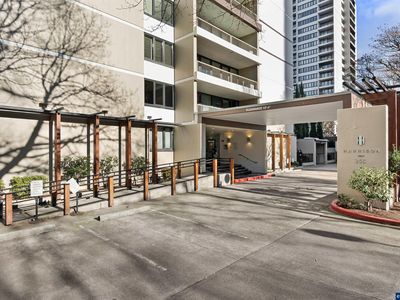
Nearby investment properties with comparable prices

Ziffy AI Summary
A quick, investor-focused snapshot highlighting income strength, yield potential.
| Key metrics | Value |
|---|---|
| Price | $399,900 |
| Est. Rent | $3,200/mo |
| ROI | 18% |
- Attractive rent-to-price ratio for income stability
- Good fit for DSCR financing with healthy coverage
Condo
Built in 1974
N/A lot
$N/A/sqft
No HOA
Neighborhood Data
Neighborhood data shown for ZIP Code: 97030, Gresham, OR area.
Housing Distribution
Housing Statistics
| Category | Value |
|---|---|
| Total HU (Housing Units) | 15,767 (100%) |
| Owner Occupied HU | 6,647 (42.2%) |
| Renter Occupied HU | 8,289 (52.6%) |
| Vacant Housing Units | 831 ( 5.3%) |
| Median Home Value | $454,651 |
| Average Home Value | $507,729 |
Housing Distribution
Address Breakdown
Residential
15,955
Single Family
12,318
Multi-Family
3,637
Businesses
1,735
Nearby investment properties with comparable rents
Nearby investment properties with comparable prices