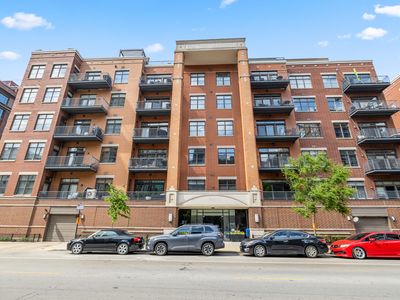
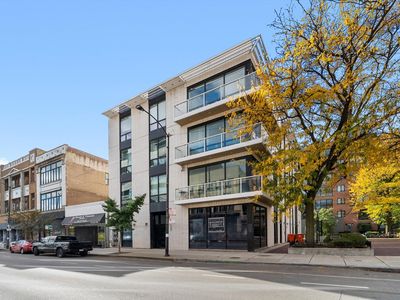
560 W Fulton St APT 403ChicagoIL60661


INVESTMENT ANALYSIS
Investment Verdict
Strong Cash FlowThe yield at 560 W Fulton St APT 403, Chicago, IL, 60661 in Chicago speaks for itself: 10.56% gross on a $725,000 price, generating $6,383/mo in rent and $578/mo in net income after the $3,260/mo debt service. DSCR 1.96, a wide margin that supports Ziffy Mortgage's DSCR loan without any personal income check. Annual cash flow of $6,937 stacks alongside $200,304 in projected five-year appreciation and $6,677/yr in principal reduction. Projected total cumulative return: $364,419.
| This Property | City Avg | |
|---|---|---|
| Gross Rental Yield | 10.6% | 6.1% |
| Monthly Cash Flow | $578 | $850 |
City averages based on Chicago market data in our database. Property projections are estimates.
DSCR Rental Loan Qualification
Qualifies using the property's rental income, not your personal income.
- ✓No W-2, pay stubs, or tax returns needed
- ✓Rental income qualifies you
- ✓Built for real estate investors
| Monthly Rental Income | $6,383 |
| Total Monthly Debt Service | $4,740 |
| DSCR Ratio | 1.35x |
Ziffy Mortgage: Your DSCR most likely meets our 1.0+ requirement, so you'll most probably qualify for our standard DSCR investment loan program. To pre-qualify, book time with your loan officer →
Estimates assume 6.0% rate / 30-yr fixed, 30% down, 1% tax, 0.5% insurance. Not a commitment to lend.
Condo
Built in 2000
N/A lot
$N/A/sqft
No HOA
Neighborhood Data
Neighborhood data shown for ZIP Code: 60661, Chicago, IL area.
Housing Distribution
Housing Statistics
| Category | Value |
|---|---|
| Total HU (Housing Units) | 10,016 (100%) |
| Owner Occupied HU | 2,442 (24.4%) |
| Renter Occupied HU | 6,535 (65.2%) |
| Vacant Housing Units | 1,039 (10.4%) |
| Median Home Value | $425,872 |
| Average Home Value | $488,274 |
Housing Distribution
Address Breakdown
Residential
9,230
Single Family
9
Multi-Family
9,221
Businesses
758


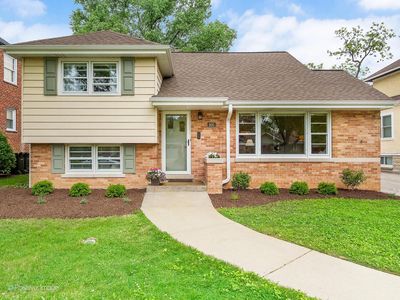
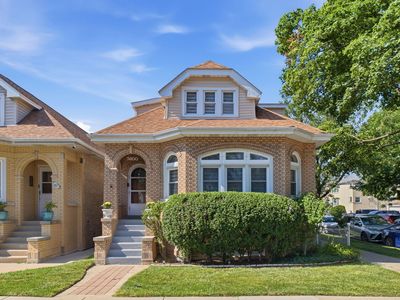
Nearby investment properties with comparable rents
Nearby investment properties with comparable prices

Ziffy AI Summary
A quick, investor-focused snapshot highlighting income strength, yield potential.
| Key metrics | Value |
|---|---|
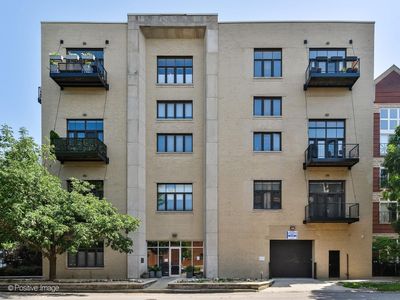
| Price | $399,900 |
| Est. Rent | $3,200/mo |
| ROI | 18% |
- Attractive rent-to-price ratio for income stability
- Good fit for DSCR financing with healthy coverage
Condo
Built in 2000
N/A lot
$N/A/sqft
No HOA
Neighborhood Data
Neighborhood data shown for ZIP Code: 60661, Chicago, IL area.
Housing Distribution
Housing Statistics
| Category | Value |
|---|---|
| Total HU (Housing Units) | 10,016 (100%) |
| Owner Occupied HU | 2,442 (24.4%) |
| Renter Occupied HU | 6,535 (65.2%) |
| Vacant Housing Units | 1,039 (10.4%) |
| Median Home Value | $425,872 |
| Average Home Value | $488,274 |
Housing Distribution
Address Breakdown
Residential
9,230
Single Family
9
Multi-Family
9,221
Businesses
758
Nearby investment properties with comparable rents
Nearby investment properties with comparable prices