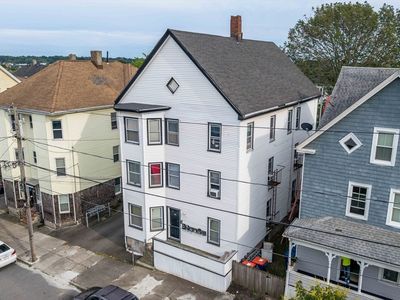
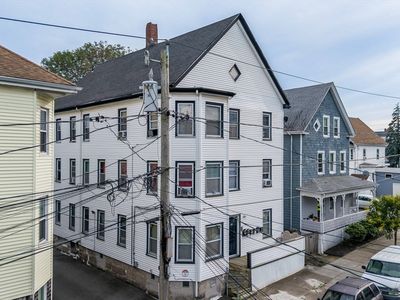
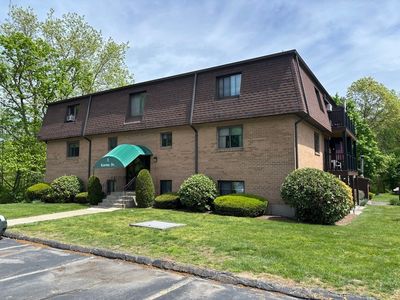
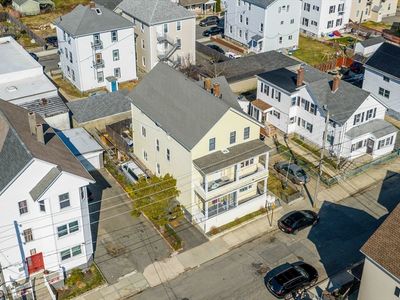
56 Nye StNew BedfordMA02746

INVESTMENT ANALYSIS
Investment Verdict
Appreciation PlayGlobal investors willing to prioritise equity over near-term yield will find 56 Nye St, New Bedford, MA, 02746 in New Bedford worth study. Rental yield 3.58%. The 3.58% gross yield is below cash-flow benchmarks at $800,000, but 5% annual appreciation, adding $221,025 over five years, frames this as a capital growth position. Rent of $2,389/mo partially offsets the $3,597/mo payment. Ziffy Mortgage finances appreciation-play properties (0.66 DSCR) for non-U.S. residents without domestic income documentation; a 30–35% down payment maximises coverage. Total projected return: $133,051.
| This Property | City Avg | |
|---|---|---|
| Gross Rental Yield | 3.6% | 6.1% |
| Monthly Cash Flow | $(2,653) | $420 |
City averages based on New Bedford market data in our database. Property projections are estimates.
DSCR Rental Loan Qualification
Qualifies using the property's rental income, not your personal income.
- ✓No W-2, pay stubs, or tax returns needed
- ✓Rental income qualifies you
- ✓Built for real estate investors
| Monthly Rental Income | $2,389 |
| Total Monthly Debt Service | $4,724 |
| DSCR Ratio | 0.51x |
Ziffy Mortgage typically prefers a DSCR of 1.0+, but in some cases you may qualify with a DSCR below 1. To explore if this deal qualifies for an investment mortgage, book time with your loan officer →
Estimates assume 6.0% rate / 30-yr fixed, 30% down, 1% tax, 0.5% insurance. Not a commitment to lend.
Multi Family
Built in 1890
4,543 sqft lot
$N/A/sqft
No HOA
Neighborhood Data
Neighborhood data shown for ZIP Code: 02746, New Bedford, MA area.
Housing Distribution
Housing Statistics
| Category | Value |
|---|---|
| Total HU (Housing Units) | 7,613 (100%) |
| Owner Occupied HU | 1,476 (19.4%) |
| Renter Occupied HU | 5,675 (74.5%) |
| Vacant Housing Units | 462 ( 6.1%) |
| Median Home Value | $332,218 |
| Average Home Value | $328,147 |
Housing Distribution
Address Breakdown
Residential
6,007
Single Family
4,020
Multi-Family
1,987
Businesses
578


Nearby investment properties with comparable rents
Nearby investment properties with comparable prices

Ziffy AI Summary
A quick, investor-focused snapshot highlighting income strength, yield potential.
| Key metrics | Value |
|---|---|
| Price | $399,900 |
| Est. Rent | $3,200/mo |
| ROI | 18% |
- Attractive rent-to-price ratio for income stability
- Good fit for DSCR financing with healthy coverage
Multi Family
Built in 1890
4,543 sqft lot
$N/A/sqft
No HOA
Neighborhood Data
Neighborhood data shown for ZIP Code: 02746, New Bedford, MA area.
Housing Distribution
Housing Statistics
| Category | Value |
|---|---|
| Total HU (Housing Units) | 7,613 (100%) |
| Owner Occupied HU | 1,476 (19.4%) |
| Renter Occupied HU | 5,675 (74.5%) |
| Vacant Housing Units | 462 ( 6.1%) |
| Median Home Value | $332,218 |
| Average Home Value | $328,147 |
Housing Distribution
Address Breakdown
Residential
6,007
Single Family
4,020
Multi-Family
1,987
Businesses
578
Nearby investment properties with comparable rents
Nearby investment properties with comparable prices
Listed by: Team ROSO • RE/MAX Vantage
Mls Name: MLS PIN
Mls ID: #73399521