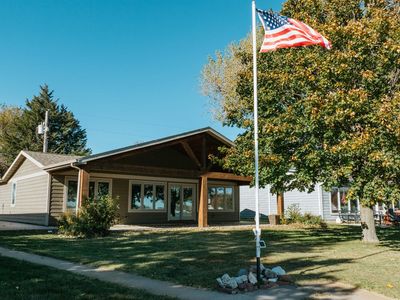
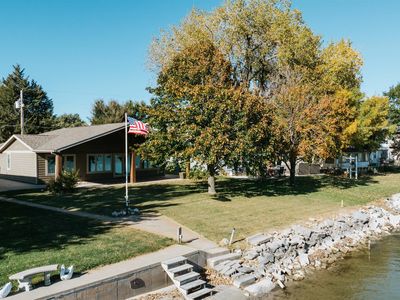
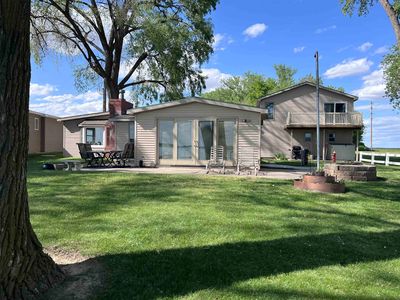
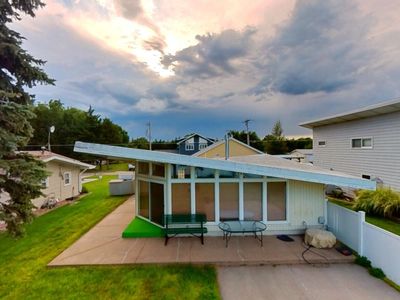
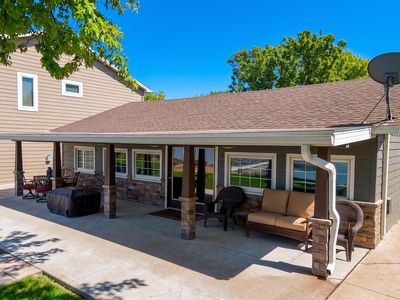
56 N Point Dr #13ElwoodNE68937
INVESTMENT ANALYSIS
Investment Verdict
Appreciation Play56 N Point Dr #13, Elwood, NE, 68937 in Elwood is priced for appreciation, not yield. Rental yield 0%. At $774,900 with a 0% gross yield, the monthly income is modest, but 5% annual price growth is projected to add $214,091 in value over five years, making equity the primary return driver. Ziffy Mortgage's DSCR mortgage (0.00) can still finance this property for non-U.S. residents; a 30–35% down payment typically produces the cleanest underwriting for appreciation-focused assets.
| This Property | National Avg | |
|---|---|---|
| Gross Rental Yield | 0% | 6.2% |
| Monthly Cash Flow | $0 | $180 |
National averages based on 2024–2025 U.S. residential rental market data. Content is user-generated and unverified.
Single Family
Built in 1965
6,724 sqft lot
$N/A/sqft
No HOA
Neighborhood Data
Neighborhood data shown for ZIP Code: 68937, Elwood, NE area.
Housing Distribution
Housing Statistics
| Category | Value |
|---|---|
| Total HU (Housing Units) | 1,230 (100%) |
| Owner Occupied HU | 637 (51.8%) |
| Renter Occupied HU | 194 (15.8%) |
| Vacant Housing Units | 399 (32.4%) |
| Median Home Value | $289,423 |
| Average Home Value | $322,747 |
Housing Distribution
Address Breakdown
Residential
747
Single Family
747
Multi-Family
0
Businesses
68


Nearby investment properties with comparable rents
No similar rental properties found nearby.
Nearby investment properties with comparable prices

Ziffy AI Summary
A quick, investor-focused snapshot highlighting income strength, yield potential.
| Key metrics | Value |
|---|---|
| Price | $399,900 |
| Est. Rent | $3,200/mo |
| ROI | 18% |
- Attractive rent-to-price ratio for income stability
- Good fit for DSCR financing with healthy coverage
Single Family
Built in 1965
6,724 sqft lot
$N/A/sqft
No HOA
Neighborhood Data
Neighborhood data shown for ZIP Code: 68937, Elwood, NE area.
Housing Distribution
Housing Statistics
| Category | Value |
|---|---|
| Total HU (Housing Units) | 1,230 (100%) |
| Owner Occupied HU | 637 (51.8%) |
| Renter Occupied HU | 194 (15.8%) |
| Vacant Housing Units | 399 (32.4%) |
| Median Home Value | $289,423 |
| Average Home Value | $322,747 |
Housing Distribution
Address Breakdown
Residential
747
Single Family
747
Multi-Family
0
Businesses
68
Nearby investment properties with comparable rents
No similar rental properties found nearby.
Nearby investment properties with comparable prices