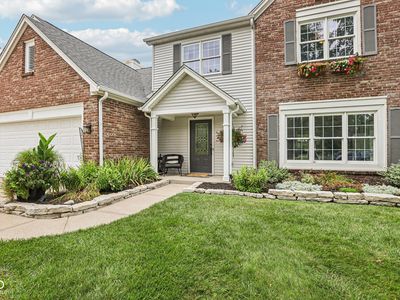
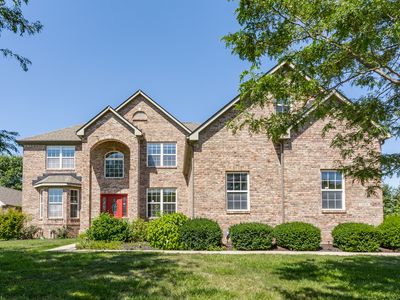
535 W 93rd StIndianapolisIN46260

INVESTMENT ANALYSIS
Investment Verdict
Appreciation PlayGlobal investors willing to prioritise equity over near-term yield will find 535 W 93rd St, Indianapolis, IN, 46260 in Indianapolis worth study. Rental yield 5.2%. The 5.2% gross yield is below cash-flow benchmarks at $1,150,000, but 5% annual appreciation, adding $317,724 over five years, frames this as a capital growth position. Rent of $4,982/mo partially offsets the $5,171/mo payment. Ziffy Mortgage finances appreciation-play properties (0.96 DSCR) for non-U.S. residents without domestic income documentation; a 30–35% down payment maximises coverage. Total projected return: $295,202.
| This Property | City Avg | |
|---|---|---|
| Gross Rental Yield | 5.2% | 6.8% |
| Monthly Cash Flow | $(2,193) | $450 |
City averages based on Indianapolis market data in our database. Property projections are estimates.
DSCR Loan Qualification
| Monthly Rental Income | $4,982 |
| Total Monthly Debt Service | $6,718 |
| DSCR Ratio | 0.74x |
Ziffy Mortgage typically prefers a DSCR of 1.0+, but in some cases you may qualify with a DSCR below 1. To explore if this deal qualifies for an investment mortgage, book time with your loan officer →
Estimates assume 6.0% rate / 30-yr fixed, 30% down, 1% tax, 0.5% insurance. Not a commitment to lend.
Single Family
Built in 1957
0.75 Acres lot
$N/A/sqft
No HOA
Neighborhood Data
Neighborhood data shown for ZIP Code: 46260, Indianapolis, IN area.
Housing Distribution
Housing Statistics
| Category | Value |
|---|---|
| Total HU (Housing Units) | 15,842 (100%) |
| Owner Occupied HU | 7,029 (44.4%) |
| Renter Occupied HU | 7,577 (47.8%) |
| Vacant Housing Units | 1,236 ( 7.8%) |
| Median Home Value | $322,134 |
| Average Home Value | $385,713 |
Housing Distribution
Address Breakdown
Residential
15,242
Single Family
11,322
Multi-Family
3,920
Businesses
683


Nearby investment properties with comparable rents


Nearby investment properties with comparable prices


Ziffy AI Summary
A quick, investor-focused snapshot highlighting income strength, yield potential.
| Key metrics | Value |
|---|---|
| Price | $399,900 |
| Est. Rent | $3,200/mo |
| ROI | 18% |
- Attractive rent-to-price ratio for income stability
- Good fit for DSCR financing with healthy coverage
Single Family
Built in 1957
0.75 Acres lot
$N/A/sqft
No HOA
Neighborhood Data
Neighborhood data shown for ZIP Code: 46260, Indianapolis, IN area.
Housing Distribution
Housing Statistics
| Category | Value |
|---|---|
| Total HU (Housing Units) | 15,842 (100%) |
| Owner Occupied HU | 7,029 (44.4%) |
| Renter Occupied HU | 7,577 (47.8%) |
| Vacant Housing Units | 1,236 ( 7.8%) |
| Median Home Value | $322,134 |
| Average Home Value | $385,713 |
Housing Distribution
Address Breakdown
Residential
15,242
Single Family
11,322
Multi-Family
3,920
Businesses
683
Nearby investment properties with comparable rents
Nearby investment properties with comparable prices
Listed by: Matt McLaughlin • F.C. Tucker Company
Mls Name: MIBOR as distributed by MLS GRID
Mls Provider:
Mls ID: #22039335
Disclaimer: Based on information submitted to the MLS GRID as of 2025-11-03 22:18:21 PST. All data is obtained from various sources and may not have been verified by broker or MLS GRID. Supplied Open House Information is subject to change without notice. All information should be independently reviewed and verified for accuracy. Properties may or may not be listed by the office/agent presenting the information. Some IDX listings have been excluded from this website. [Click here for more information](/mls-disclaimers/#48)