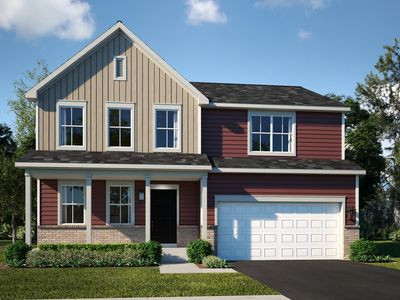
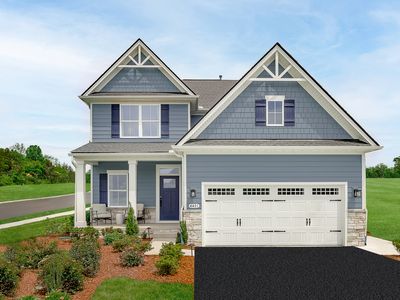
531 N Oak StHinckleyIL60520
INVESTMENT ANALYSIS
Investment Verdict
Appreciation Play531 N Oak St, Hinckley, IL, 60520 in Hinckley is priced for appreciation, not yield. Rental yield 0%. At $424,990 with a 0% gross yield, the monthly income is modest, but 5% annual price growth is projected to add $117,417 in value over five years, making equity the primary return driver. Ziffy Mortgage's DSCR mortgage (0.00) can still finance this property for non-U.S. residents; a 30–35% down payment typically produces the cleanest underwriting for appreciation-focused assets.
| This Property | City Avg | |
|---|---|---|
| Gross Rental Yield | 0% | 7.0% |
| Monthly Cash Flow | $0 | $1,200 |
City averages based on Hinckley market data in our database. Property projections are estimates.
Single Family
Built in 2026
0.26 Acres lot
$N/A/sqft
$525 annually HOA
Neighborhood Data
Neighborhood data shown for ZIP Code: 60520, Hinckley, IL area.
Housing Distribution
Housing Statistics
| Category | Value |
|---|---|
| Total HU (Housing Units) | 1,148 (100%) |
| Owner Occupied HU | 862 (75.1%) |
| Renter Occupied HU | 217 (18.9%) |
| Vacant Housing Units | 69 ( 6.0%) |
| Median Home Value | $297,566 |
| Average Home Value | $330,171 |
Housing Distribution
Address Breakdown
Residential
978
Single Family
960
Multi-Family
18
Businesses
93


Nearby investment properties with comparable rents
No similar rental properties found nearby.
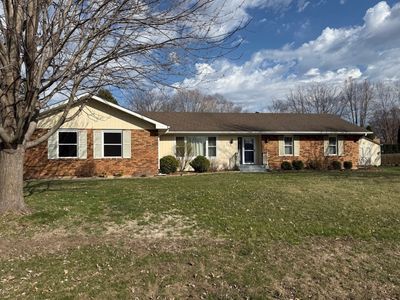
Nearby investment properties with comparable prices
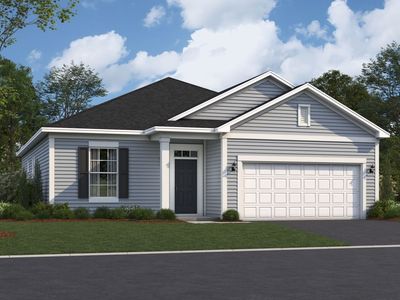
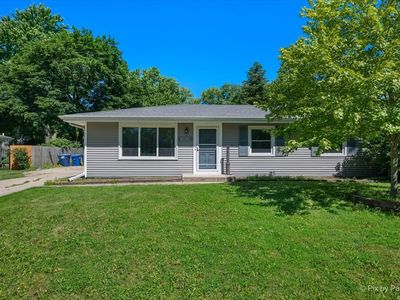

Ziffy AI Summary
A quick, investor-focused snapshot highlighting income strength, yield potential.
| Key metrics | Value |
|---|---|
| Price | $399,900 |
| Est. Rent | $3,200/mo |
| ROI | 18% |
- Attractive rent-to-price ratio for income stability
- Good fit for DSCR financing with healthy coverage
Single Family
Built in 2026
0.26 Acres lot
$N/A/sqft
$525 annually HOA
Neighborhood Data
Neighborhood data shown for ZIP Code: 60520, Hinckley, IL area.
Housing Distribution
Housing Statistics
| Category | Value |
|---|---|
| Total HU (Housing Units) | 1,148 (100%) |
| Owner Occupied HU | 862 (75.1%) |
| Renter Occupied HU | 217 (18.9%) |
| Vacant Housing Units | 69 ( 6.0%) |
| Median Home Value | $297,566 |
| Average Home Value | $330,171 |
Housing Distribution
Address Breakdown
Residential
978
Single Family
960
Multi-Family
18
Businesses
93
Nearby investment properties with comparable rents
No similar rental properties found nearby.
Nearby investment properties with comparable prices
Listed by: Bill Flemming • HomeSmart Connect LLC
Mls Name: MRED as distributed by MLS GRID
Mls Provider:
Mls ID: #12603342
Disclaimer: Based on information submitted to the MLS GRID as of 2026. All data is obtained from various sources and may not have been verified by broker or MLS GRID. Supplied Open House Information is subject to change without notice. All information should be independently reviewed and verified for accuracy. Properties may or may not be listed by the office/agent presenting the information. [Click here for more information](/mls-disclaimers/#17)