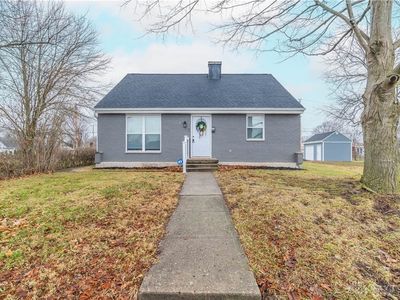
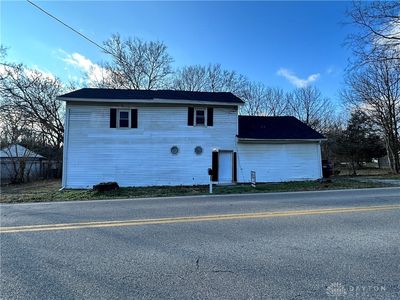
530 Gray StPiquaOH45356


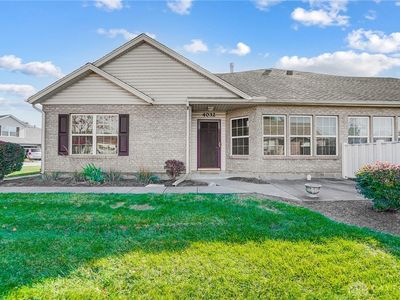
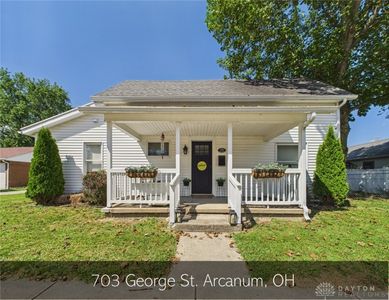
Nearby investment properties with comparable rents
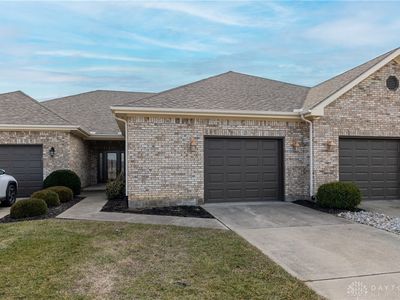
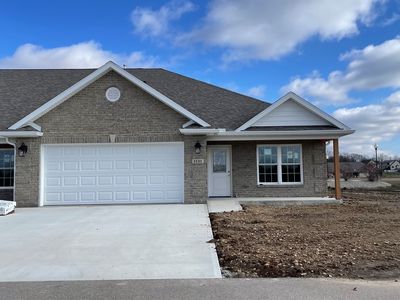
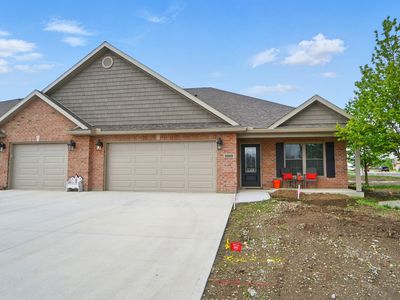
Nearby investment properties with comparable prices


Ziffy AI Summary
A quick, investor-focused snapshot highlighting income strength, yield potential.
| Key metrics | Value |
|---|---|
| Price | $399,900 |
| Est. Rent | $3,200/mo |
| ROI | 18% |
- Attractive rent-to-price ratio for income stability
- Good fit for DSCR financing with healthy coverage
Investment Highlights
Investment property for sale in Piqua at 530 Gray St, Piqua, OH, 45356 at $214,900 posts ROI 25.83% with $351/mo cash flow from $1,765/mo rent. Total monthly income equals $1,765/mo, and annual cash flow records $4,215/yr on $71,239 to close. Return on cash invested measures 25.83% and rental yield reads 9.86% at the current $214,900. Equity gained on principal adds $1,387/yr, and 5% annual appreciation supports $59,373 by year five. Five-year ROI prints 135.14% and total cumulative return in cash totals $96,270.
You can finance with Ziffy Mortgage’s DSCR loan, which relies on $1,765/mo property income rather than your personal income records (W2s, Paystubs, and Tax returns).
Single Family
Built in 1969
4,356 sqft lot
$N/A/sqft
No HOA
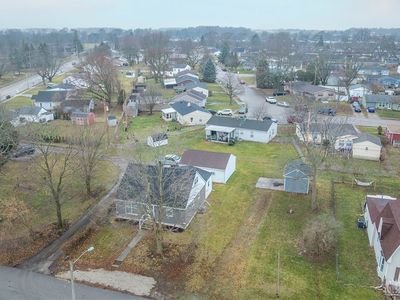
Neighborhood Data
Neighborhood data shown for ZIP Code: 45356, Piqua, OH area.
Housing Distribution
Housing Statistics
| Category | Value |
|---|---|
| Total HU (Housing Units) | 11,349 (100%) |
| Owner Occupied HU | 6,943 (61.2%) |
| Renter Occupied HU | 3,660 (32.2%) |
| Vacant Housing Units | 746 ( 6.6%) |
| Median Home Value | $166,334 |
| Average Home Value | $238,466 |
Housing Distribution
Address Breakdown
Residential
10,665
Single Family
10,163
Multi-Family
502
Businesses
765
Nearby investment properties with comparable rents
Nearby investment properties with comparable prices