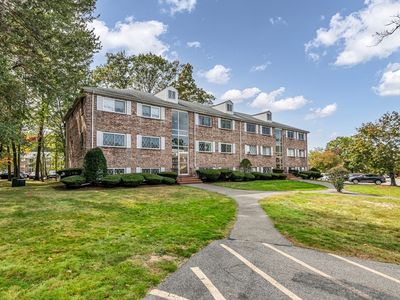
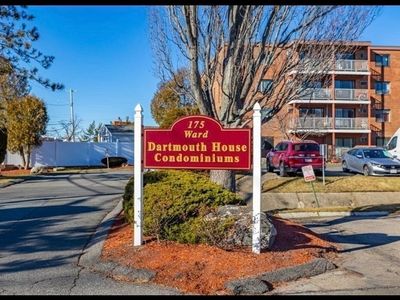
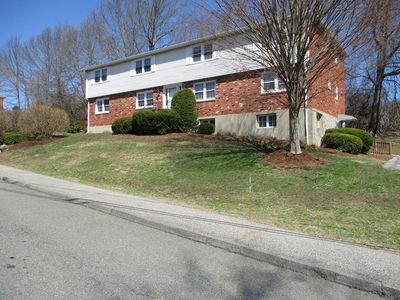
52 Fernview Ave APT 7North AndoverMA01845
INVESTMENT ANALYSIS
Investment Verdict
Solid IncomeNot flashy, but dependably profitable, 52 Fernview Ave APT 7, North Andover, MA, 01845 in North Andover is listed at $360,000 and delivers $2,815/mo in rent and $546/mo in net monthly cash flow. The 9.38% yield and 1.74 DSCR provide the underwriting comfort Ziffy Mortgage needs to approve a DSCR loan without W-2 or tax-return documentation. Projected 5% annual appreciation adds $99,461 over five years, and $3,316/yr in principal reduction supplements cash return. Total projected cumulative return: $171,795.
| This Property | City Avg | |
|---|---|---|
| Gross Rental Yield | 9.4% | 5.5% |
| Monthly Cash Flow | $546 | $350 |
City averages based on North Andover market data in our database. Property projections are estimates.
DSCR Rental Loan Qualification
Qualifies using the property's rental income, not your personal income.
- ✓No W-2, pay stubs, or tax returns needed
- ✓Rental income qualifies you
- ✓Built for real estate investors
| Monthly Rental Income | $2,815 |
| Total Monthly Debt Service | $2,126 |
| DSCR Ratio | 1.32x |
Ziffy Mortgage: Your DSCR most likely meets our 1.0+ requirement, so you'll most probably qualify for our standard DSCR investment loan program. To pre-qualify, book time with your loan officer →
Estimates assume 6.0% rate / 30-yr fixed, 30% down, 1% tax, 0.5% insurance. Not a commitment to lend.
Condo
Built in 1967
40.80 Acres lot
$N/A/sqft
No HOA
Neighborhood Data
Neighborhood data shown for ZIP Code: 01845, North Andover, MA area.
Housing Distribution
Housing Statistics
| Category | Value |
|---|---|
| Total HU (Housing Units) | 12,358 (100%) |
| Owner Occupied HU | 8,307 (67.2%) |
| Renter Occupied HU | 3,501 (28.3%) |
| Vacant Housing Units | 550 ( 4.5%) |
| Median Home Value | $773,736 |
| Average Home Value | $807,808 |
Housing Distribution
Address Breakdown
Residential
12,197
Single Family
8,665
Multi-Family
3,532
Businesses
1,177


Nearby investment properties with comparable rents
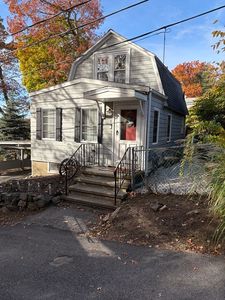
Nearby investment properties with comparable prices


Ziffy AI Summary
A quick, investor-focused snapshot highlighting income strength, yield potential.
| Key metrics | Value |
|---|---|
| Price | $399,900 |
| Est. Rent | $3,200/mo |
| ROI | 18% |
- Attractive rent-to-price ratio for income stability
- Good fit for DSCR financing with healthy coverage
Condo
Built in 1967
40.80 Acres lot
$N/A/sqft
No HOA
Neighborhood Data
Neighborhood data shown for ZIP Code: 01845, North Andover, MA area.
Housing Distribution
Housing Statistics
| Category | Value |
|---|---|
| Total HU (Housing Units) | 12,358 (100%) |
| Owner Occupied HU | 8,307 (67.2%) |
| Renter Occupied HU | 3,501 (28.3%) |
| Vacant Housing Units | 550 ( 4.5%) |
| Median Home Value | $773,736 |
| Average Home Value | $807,808 |
Housing Distribution
Address Breakdown
Residential
12,197
Single Family
8,665
Multi-Family
3,532
Businesses
1,177
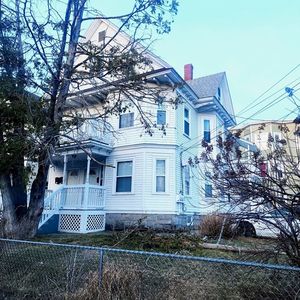
Nearby investment properties with comparable rents
Nearby investment properties with comparable prices
Listed by: Lynne Rudnicki • Home Seller's Edge
Mls Name: MLS PIN
Mls ID: #73437622