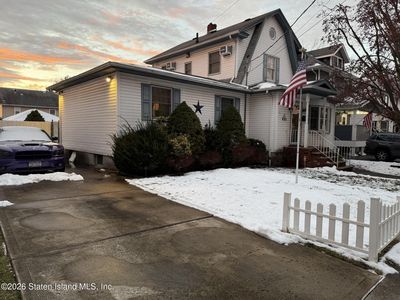
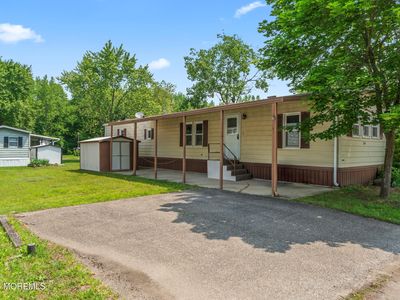
51 Graham BlvdStaten IslandNY10305


Nearby investment properties with comparable rents
Nearby investment properties with comparable prices


Ziffy AI Summary
A quick, investor-focused snapshot highlighting income strength, yield potential.
| Key metrics | Value |
|---|---|
| Price | $399,900 |
| Est. Rent | $3,200/mo |
| ROI | 18% |
- Attractive rent-to-price ratio for income stability
- Good fit for DSCR financing with healthy coverage
Investment Highlights
Investment property for sale in Staten Island at 51 Graham Blvd, Staten Island, NY, 10305 listed at $183,000 pairs $5,210/mo rent with a $896/mo payment to leave $3,988/mo cash flow. Total monthly income runs $5,210/mo, and annual cash flow reaches $47,852/yr on $60,665 cash to close. Return on cash invested measures 98.79% in year one, and rental yield registers 34.16% at a $183,000 basis. Equity gained on principal adds $1,181/yr, and annual property appreciation at 5% supports $50,560 by year five. Five-year ROI tracks 526.49% and total cumulative return in cash totals $319,391. Financing can be arranged with Ziffy Mortgage’s DSCR loan, which qualifies using $5,210/mo property income relative to a $896/mo payment rather than your personal income (W2, Tax Returns, Paystubs, or 1099).
Home Type Unknown
Built in 1930
4,000 sqft lot
$N/A/sqft
No HOA
Neighborhood Data
Neighborhood data shown for ZIP Code: 10305, Staten Island, NY area.
Housing Distribution
Housing Statistics
| Category | Value |
|---|---|
| Total HU (Housing Units) | 16,367 (100%) |
| Owner Occupied HU | 8,911 (54.4%) |
| Renter Occupied HU | 6,522 (39.8%) |
| Vacant Housing Units | 934 ( 5.7%) |
| Median Home Value | $679,181 |
| Average Home Value | $717,006 |
Housing Distribution
Address Breakdown
Residential
13,532
Single Family
11,254
Multi-Family
2,278
Businesses
873
Nearby investment properties with comparable rents
Nearby investment properties with comparable prices
Listed by: N/A • N/A
Mls Name: undefined
Mls ID: #N/A