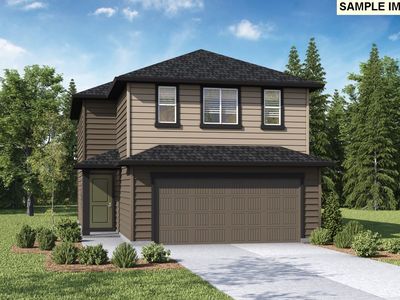
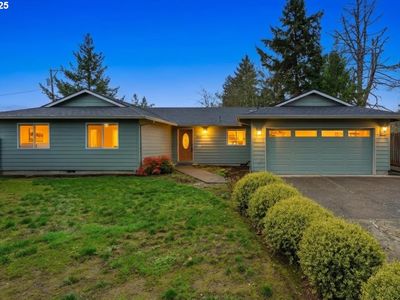
4901 NE 62nd AveVancouverWA98661
INVESTMENT ANALYSIS
Investment Verdict
Appreciation Play4901 NE 62nd Ave, Vancouver, WA, 98661 in Vancouver is priced for appreciation, not yield. Rental yield 0%. At $526,995 with a 0% gross yield, the monthly income is modest, but 5% annual price growth is projected to add $145,599 in value over five years, making equity the primary return driver. Ziffy Mortgage's DSCR mortgage (0.00) can still finance this property for non-U.S. residents; a 30–35% down payment typically produces the cleanest underwriting for appreciation-focused assets.
| This Property | City Avg | |
|---|---|---|
| Gross Rental Yield | 0% | 5.2% |
| Monthly Cash Flow | $0 | $850 |
City averages based on Vancouver market data in our database. Property projections are estimates.
Single Family
Built in N/A
N/A lot
$N/A/sqft
No HOA
Neighborhood Data
Neighborhood data shown for ZIP Code: 98661, Vancouver, WA area.
Housing Distribution
Housing Statistics
| Category | Value |
|---|---|
| Total HU (Housing Units) | 20,896 (100%) |
| Owner Occupied HU | 8,535 (40.8%) |
| Renter Occupied HU | 11,444 (54.8%) |
| Vacant Housing Units | 917 ( 4.4%) |
| Median Home Value | $541,320 |
| Average Home Value | $633,789 |
Housing Distribution
Address Breakdown
Residential
21,033
Single Family
17,217
Multi-Family
3,816
Businesses
1,290


Nearby investment properties with comparable rents
No similar rental properties found nearby.
Nearby investment properties with comparable prices
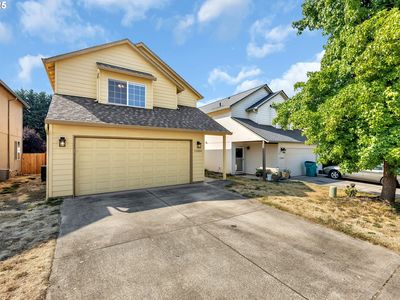

Ziffy AI Summary
A quick, investor-focused snapshot highlighting income strength, yield potential.
| Key metrics | Value |
|---|---|
| Price | $399,900 |
| Est. Rent | $3,200/mo |
| ROI | 18% |
- Attractive rent-to-price ratio for income stability
- Good fit for DSCR financing with healthy coverage
Single Family
Built in N/A
N/A lot
$N/A/sqft
No HOA
Neighborhood Data
Neighborhood data shown for ZIP Code: 98661, Vancouver, WA area.
Housing Distribution
Housing Statistics
| Category | Value |
|---|---|
| Total HU (Housing Units) | 20,896 (100%) |
| Owner Occupied HU | 8,535 (40.8%) |
| Renter Occupied HU | 11,444 (54.8%) |
| Vacant Housing Units | 917 ( 4.4%) |
| Median Home Value | $541,320 |
| Average Home Value | $633,789 |
Housing Distribution
Address Breakdown
Residential
21,033
Single Family
17,217
Multi-Family
3,816
Businesses
1,290
Nearby investment properties with comparable rents
No similar rental properties found nearby.
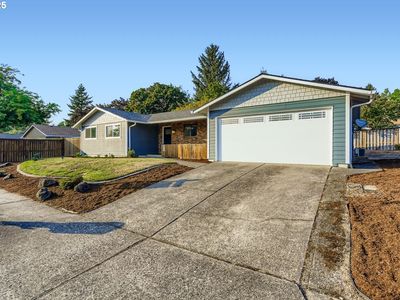
Nearby investment properties with comparable prices
Listed by: N/A • N/A
Mls Name: undefined
Mls ID: #161286001