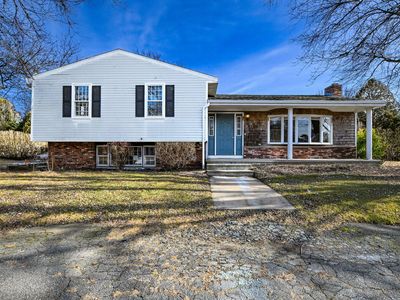
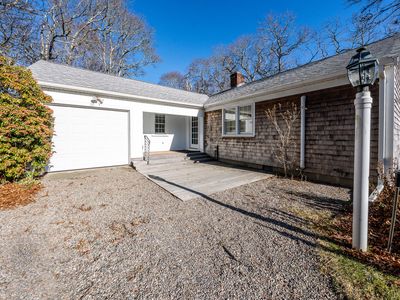
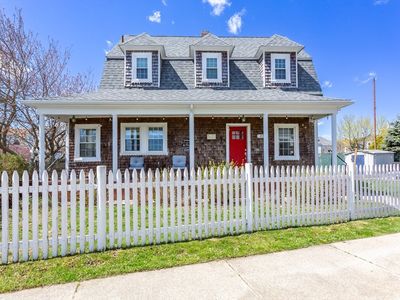
49 Broken Bow LaneEast FalmouthMA02536
INVESTMENT ANALYSIS
Investment Verdict
Solid IncomeReliable, bankable, and well-priced, 49 Broken Bow Lane, East Falmouth, MA, 02536 in East Falmouth delivers $3,798/mo in gross rent and $464/mo in net monthly income at a $529,000 entry. The 8.62% yield and 1.60 DSCR make it a clean candidate for Ziffy Mortgage's DSCR loan; no W-2s or U.S. credit history required. With 5% annual appreciation projecting $146,153 over five years and $4,872/yr in equity from loan paydown, total projected return is $230,674.
| This Property | City Avg | |
|---|---|---|
| Gross Rental Yield | 8.6% | 7.2% |
| Monthly Cash Flow | $464 | $850 |
City averages based on East Falmouth market data in our database. Property projections are estimates.
DSCR Rental Loan Qualification
Qualifies using the property's rental income, not your personal income.
- ✓No W-2, pay stubs, or tax returns needed
- ✓Rental income qualifies you
- ✓Built for real estate investors
| Monthly Rental Income | $3,798 |
| Total Monthly Debt Service | $3,124 |
| DSCR Ratio | 1.22x |
Ziffy Mortgage: Your DSCR most likely meets our 1.0+ requirement, so you'll most probably qualify for our standard DSCR investment loan program. To pre-qualify, book time with your loan officer →
Estimates assume 6.0% rate / 30-yr fixed, 30% down, 1% tax, 0.5% insurance. Not a commitment to lend.
Single Family
Built in 1974
10,454 sqft lot
$N/A/sqft
No HOA
Neighborhood Data
Neighborhood data shown for ZIP Code: 02536, East Falmouth, MA area.
Housing Distribution
Housing Statistics
| Category | Value |
|---|---|
| Total HU (Housing Units) | 12,923 (100%) |
| Owner Occupied HU | 7,193 (55.7%) |
| Renter Occupied HU | 1,551 (12.0%) |
| Vacant Housing Units | 4,179 (32.3%) |
| Median Home Value | $703,795 |
| Average Home Value | $801,507 |
Housing Distribution
Address Breakdown
Residential
11,643
Single Family
11,560
Multi-Family
83
Businesses
410


Nearby investment properties with comparable rents

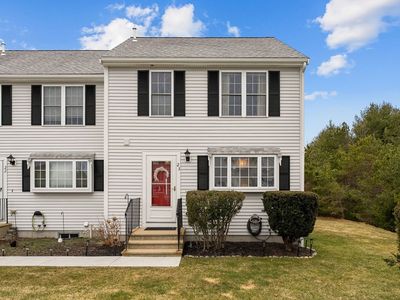
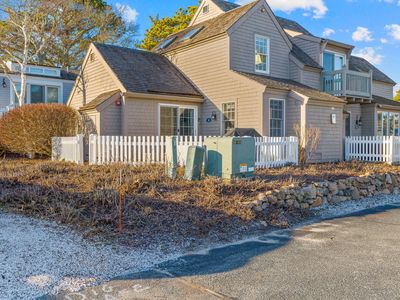
Nearby investment properties with comparable prices
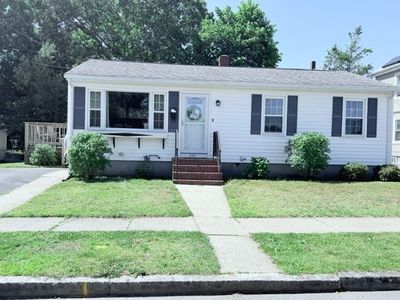
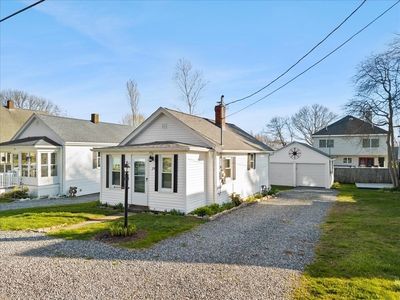

Ziffy AI Summary
A quick, investor-focused snapshot highlighting income strength, yield potential.
| Key metrics | Value |
|---|---|
| Price | $399,900 |
| Est. Rent | $3,200/mo |
| ROI | 18% |
- Attractive rent-to-price ratio for income stability
- Good fit for DSCR financing with healthy coverage
Single Family
Built in 1974
10,454 sqft lot
$N/A/sqft
No HOA
Neighborhood Data
Neighborhood data shown for ZIP Code: 02536, East Falmouth, MA area.
Housing Distribution
Housing Statistics
| Category | Value |
|---|---|
| Total HU (Housing Units) | 12,923 (100%) |
| Owner Occupied HU | 7,193 (55.7%) |
| Renter Occupied HU | 1,551 (12.0%) |
| Vacant Housing Units | 4,179 (32.3%) |
| Median Home Value | $703,795 |
| Average Home Value | $801,507 |
Housing Distribution
Address Breakdown
Residential
11,643
Single Family
11,560
Multi-Family
83
Businesses
410
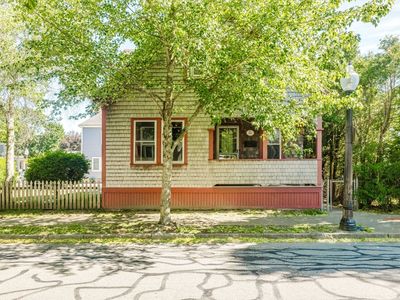
Nearby investment properties with comparable rents
Nearby investment properties with comparable prices
Listed by: Ann Lynch • Kinlin Grover Compass
Mls Name: CCIMLS
Mls ID: #22600276