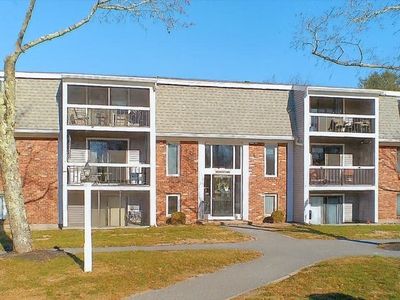
479 Central StEast BridgewaterMA02333


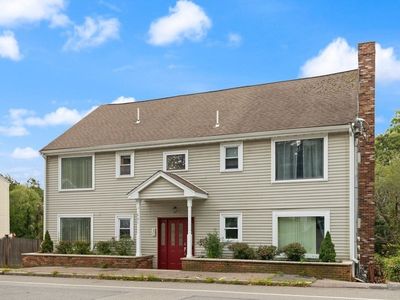
Nearby investment properties with comparable rents
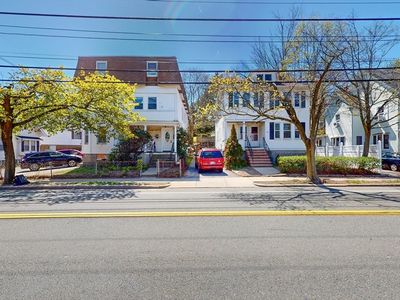
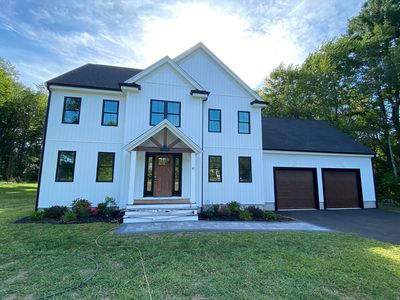

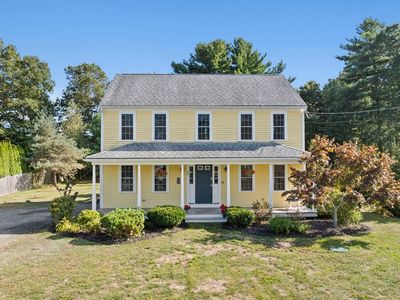
Nearby investment properties with comparable prices

Ziffy AI Summary
A quick, investor-focused snapshot highlighting income strength, yield potential.
| Key metrics | Value |
|---|---|
| Price | $399,900 |
| Est. Rent | $3,200/mo |
| ROI | 18% |
- Attractive rent-to-price ratio for income stability
- Good fit for DSCR financing with healthy coverage
Investment Highlights
Rental property for sale in East Bridgewater at 479 Central St, East Bridgewater, MA, 02333 generates $4,680/mo in rent and, after a $1,957/mo payment, leaves $2,160/mo in cash flow. Total monthly income is $4,680/mo, and annual cash flow is $25,918/yr on $132,567 invested. Return on cash invested sits at 39.46% in year one, and rental yield is 14.04% on a $399,900 entry. Equity gained on principal adds $2,580/yr, while 5% annual appreciation builds toward $110,485 over five years. Five-year ROI reaches 207.82% and total cumulative return in cash sums $275,504. For financing, investors can use Ziffy Mortgage’s DSCR loan, which considers $4,680/mo property income rather than buyer’s personal income.
Single Family
Built in 1850
0.61 Acres lot
$N/A/sqft
No HOA
Neighborhood Data
Neighborhood data shown for ZIP Code: 02333, East Bridgewater, MA area.
Housing Distribution
Housing Statistics
| Category | Value |
|---|---|
| Total HU (Housing Units) | 5,316 (100%) |
| Owner Occupied HU | 4,432 (83.4%) |
| Renter Occupied HU | 763 (14.4%) |
| Vacant Housing Units | 121 ( 2.3%) |
| Median Home Value | $580,739 |
| Average Home Value | $609,764 |
Housing Distribution
Address Breakdown
Residential
5,039
Single Family
4,892
Multi-Family
147
Businesses
392
Nearby investment properties with comparable rents
Nearby investment properties with comparable prices
Listed by: N/A • N/A
Mls Name: undefined
Mls ID: #N/A