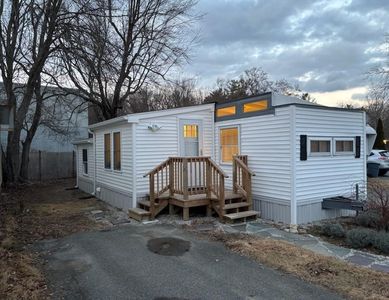
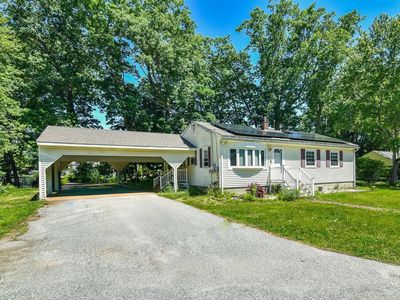
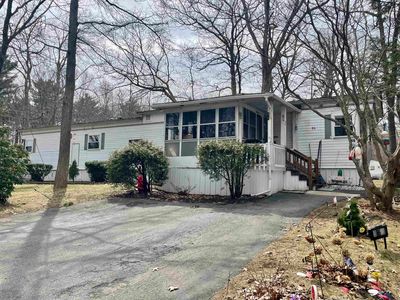
466 Newbury St #20DanversMA01923
INVESTMENT ANALYSIS
Investment Verdict
Solid IncomeInvestors who value predictability will appreciate 466 Newbury St #20, Danvers, MA, 01923 in Danvers. At $149,900 it earns $1,175/mo in rent and distributes $230/mo to the owner after the $674/mo payment, a consistent 9.41% yield. DSCR 1.74 clears Ziffy Mortgage's income-only underwriting standard. Over five years, 5% annual appreciation adds $41,415 in value; $1,381/yr in principal paydown compounds ownership stake. Total projected return: $71,735.
| This Property | City Avg | |
|---|---|---|
| Gross Rental Yield | 9.4% | 6.5% |
| Monthly Cash Flow | $230 | $450 |
City averages based on Danvers market data in our database. Property projections are estimates.
DSCR Rental Loan Qualification
Qualifies using the property's rental income, not your personal income.
- ✓No W-2, pay stubs, or tax returns needed
- ✓Rental income qualifies you
- ✓Built for real estate investors
| Monthly Rental Income | $1,175 |
| Total Monthly Debt Service | $885 |
| DSCR Ratio | 1.33x |
Ziffy Mortgage: Your DSCR most likely meets our 1.0+ requirement, so you'll most probably qualify for our standard DSCR investment loan program. To pre-qualify, book time with your loan officer →
Estimates assume 6.0% rate / 30-yr fixed, 30% down, 1% tax, 0.5% insurance. Not a commitment to lend.
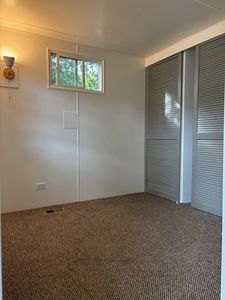
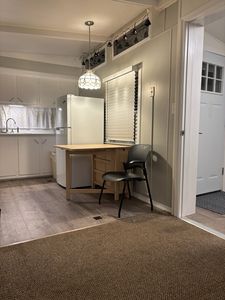
Manufactured
Built in 1959
N/A lot
$N/A/sqft
No HOA
Neighborhood Data
Neighborhood data shown for ZIP Code: 01923, Danvers, MA area.
Housing Distribution
Housing Statistics
| Category | Value |
|---|---|
| Total HU (Housing Units) | 11,985 (100%) |
| Owner Occupied HU | 8,185 (68.3%) |
| Renter Occupied HU | 3,242 (27.1%) |
| Vacant Housing Units | 558 ( 4.7%) |
| Median Home Value | $677,909 |
| Average Home Value | $714,250 |
Housing Distribution
Address Breakdown
Residential
11,546
Single Family
8,892
Multi-Family
2,654
Businesses
1,526


Nearby investment properties with comparable rents

Nearby investment properties with comparable prices

Ziffy AI Summary
A quick, investor-focused snapshot highlighting income strength, yield potential.
| Key metrics | Value |
|---|---|
| Price | $399,900 |
| Est. Rent | $3,200/mo |
| ROI | 18% |
- Attractive rent-to-price ratio for income stability
- Good fit for DSCR financing with healthy coverage
Manufactured
Built in 1959
N/A lot
$N/A/sqft
No HOA
Neighborhood Data
Neighborhood data shown for ZIP Code: 01923, Danvers, MA area.
Housing Distribution
Housing Statistics
| Category | Value |
|---|---|
| Total HU (Housing Units) | 11,985 (100%) |
| Owner Occupied HU | 8,185 (68.3%) |
| Renter Occupied HU | 3,242 (27.1%) |
| Vacant Housing Units | 558 ( 4.7%) |
| Median Home Value | $677,909 |
| Average Home Value | $714,250 |
Housing Distribution
Address Breakdown
Residential
11,546
Single Family
8,892
Multi-Family
2,654
Businesses
1,526
Nearby investment properties with comparable rents
Nearby investment properties with comparable prices
Listed by: N/A • N/A
Mls Name: MLS PIN
Mls ID: #73471403