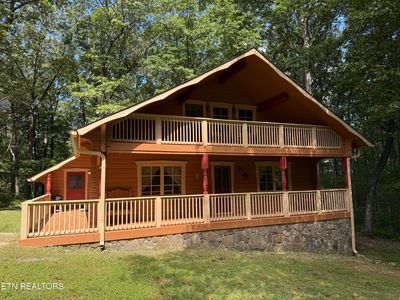
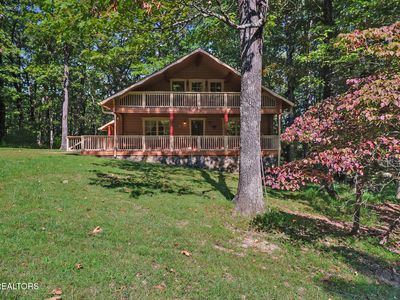
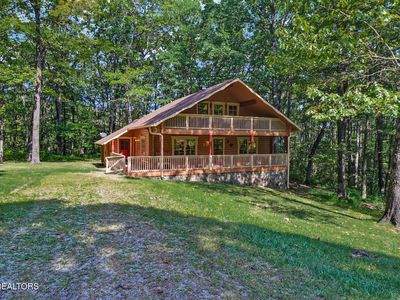
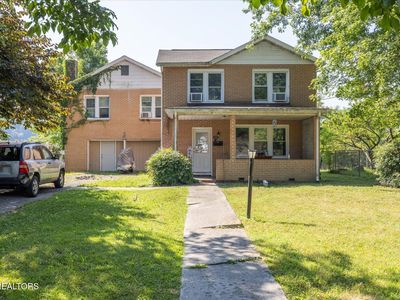
458 Running Deer DrCrab OrchardTN37723
INVESTMENT ANALYSIS
Investment Verdict
Appreciation PlayInvestors who prioritise long-run asset value over immediate income should consider 458 Running Deer Dr, Crab Orchard, TN, 37723 in Crab Orchard. Rental yield 0%. At $289,000 with 0% gross yield, current distributions are modest, but the 5% appreciation rate projects $79,845 in new equity by year five, complemented by $2,662/yr in principal paydown. Ziffy Mortgage's DSCR loan (0.00) allows non-U.S. residents to acquire without W-2s or domestic credit.
| This Property | National Avg | |
|---|---|---|
| Gross Rental Yield | 0% | 6.2% |
| Monthly Cash Flow | $0 | $180 |
National averages based on 2024–2025 U.S. residential rental market data. Content is user-generated and unverified.
Single Family
Built in 1988
0.37 Acres lot
$N/A/sqft
No HOA
Neighborhood Data
Neighborhood data shown for ZIP Code: 37723, Crab Orchard, TN area.
Housing Distribution
Housing Statistics
| Category | Value |
|---|---|
| Total HU (Housing Units) | 463 (100%) |
| Owner Occupied HU | 329 (71.1%) |
| Renter Occupied HU | 59 (12.7%) |
| Vacant Housing Units | 75 (16.2%) |
| Median Home Value | $215,278 |
| Average Home Value | $258,822 |
Housing Distribution
Address Breakdown
Residential
350
Single Family
350
Multi-Family
0
Businesses
25


Nearby investment properties with comparable rents
No similar rental properties found nearby.
Nearby investment properties with comparable prices

Ziffy AI Summary
A quick, investor-focused snapshot highlighting income strength, yield potential.
| Key metrics | Value |
|---|---|
| Price | $399,900 |
| Est. Rent | $3,200/mo |
| ROI | 18% |
- Attractive rent-to-price ratio for income stability
- Good fit for DSCR financing with healthy coverage
Single Family
Built in 1988
0.37 Acres lot
$N/A/sqft
No HOA
Neighborhood Data
Neighborhood data shown for ZIP Code: 37723, Crab Orchard, TN area.
Housing Distribution
Housing Statistics
| Category | Value |
|---|---|
| Total HU (Housing Units) | 463 (100%) |
| Owner Occupied HU | 329 (71.1%) |
| Renter Occupied HU | 59 (12.7%) |
| Vacant Housing Units | 75 (16.2%) |
| Median Home Value | $215,278 |
| Average Home Value | $258,822 |
Housing Distribution
Address Breakdown
Residential
350
Single Family
350
Multi-Family
0
Businesses
25
Nearby investment properties with comparable rents
No similar rental properties found nearby.
Nearby investment properties with comparable prices
Listed by: Keith Moerdyk • Better Homes and Garden Real Estate Gwin Realty
Mls Name: East Tennessee Realtors
Mls ID: #1315725