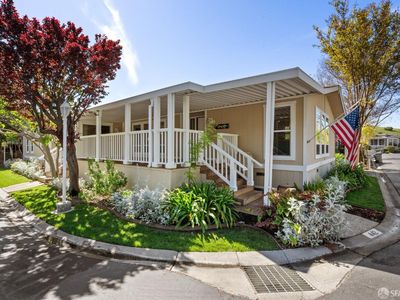
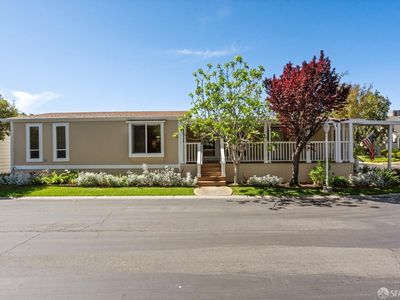
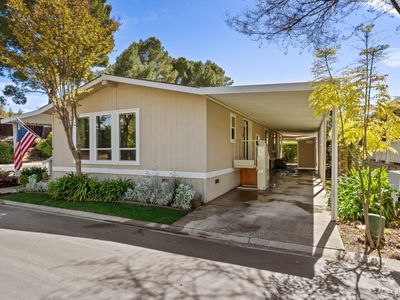
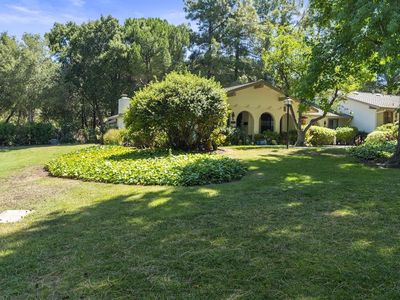
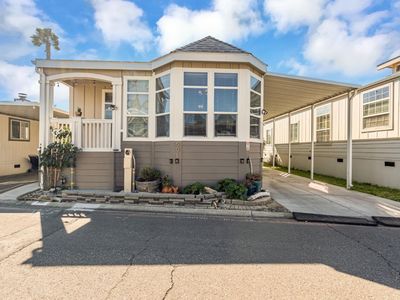
442 Mill Pond Dr #442San JoseCA95125
INVESTMENT ANALYSIS
Investment Verdict
Strong Cash Flow442 Mill Pond Dr #442, San Jose, CA, 95125 in San Jose earns its strong cash-flow label: 10.75% yield, $4,255/mo rent, $1,317/mo net income, DSCR 1.99. The $475,000 acquisition cost produces immediate returns that put this property in the top tier for U.S. income assets accessible via Ziffy Mortgage's rental-income underwriting. Long-term, 5% annual appreciation adds $131,234 by year five. Combined with $4,375/yr in principal paydown, total projected return reaches $264,854.
| This Property | City Avg | |
|---|---|---|
| Gross Rental Yield | 10.8% | 6.0% |
| Monthly Cash Flow | $1,317 | $500 |
City averages based on San Jose market data in our database. Property projections are estimates.
DSCR Rental Loan Qualification
Qualifies using the property's rental income, not your personal income.
- ✓No W-2, pay stubs, or tax returns needed
- ✓Rental income qualifies you
- ✓Built for real estate investors
| Monthly Rental Income | $4,255 |
| Total Monthly Debt Service | $2,749 |
| DSCR Ratio | 1.55x |
Ziffy Mortgage: Your DSCR most likely meets our 1.0+ requirement, so you'll most probably qualify for our standard DSCR investment loan program. To pre-qualify, book time with your loan officer →
Estimates assume 6.0% rate / 30-yr fixed, 30% down, 1% tax, 0.5% insurance. Not a commitment to lend.
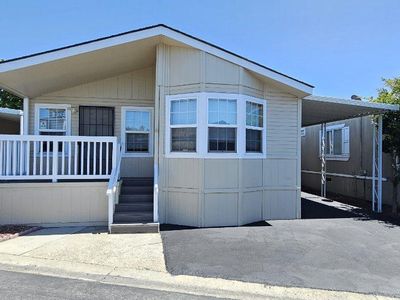
Manufactured
Built in 1978
N/A lot
$N/A/sqft
No HOA
Neighborhood Data
Neighborhood data shown for ZIP Code: 95125, San Jose, CA area.
Housing Distribution
Housing Statistics
| Category | Value |
|---|---|
| Total HU (Housing Units) | 21,815 (100%) |
| Owner Occupied HU | 12,828 (58.8%) |
| Renter Occupied HU | 8,020 (36.8%) |
| Vacant Housing Units | 967 ( 4.4%) |
| Median Home Value | $1,688,209 |
| Average Home Value | $1,602,473 |
Housing Distribution
Address Breakdown
Residential
21,513
Single Family
17,972
Multi-Family
3,541
Businesses
1,706


Nearby investment properties with comparable rents

Nearby investment properties with comparable prices

Ziffy AI Summary
A quick, investor-focused snapshot highlighting income strength, yield potential.
| Key metrics | Value |
|---|---|
| Price | $399,900 |
| Est. Rent | $3,200/mo |
| ROI | 18% |
- Attractive rent-to-price ratio for income stability
- Good fit for DSCR financing with healthy coverage
Manufactured
Built in 1978
N/A lot
$N/A/sqft
No HOA
Neighborhood Data
Neighborhood data shown for ZIP Code: 95125, San Jose, CA area.
Housing Distribution
Housing Statistics
| Category | Value |
|---|---|
| Total HU (Housing Units) | 21,815 (100%) |
| Owner Occupied HU | 12,828 (58.8%) |
| Renter Occupied HU | 8,020 (36.8%) |
| Vacant Housing Units | 967 ( 4.4%) |
| Median Home Value | $1,688,209 |
| Average Home Value | $1,602,473 |
Housing Distribution
Address Breakdown
Residential
21,513
Single Family
17,972
Multi-Family
3,541
Businesses
1,706
Nearby investment properties with comparable rents
Nearby investment properties with comparable prices
Listed by: Nicholas S. Honda • Realty World Bay Area R.E.
Mls Name: SFAR
Mls Provider:
Mls ID: #425031489
Disclaimer: IDX information is provided exclusively for personal, non-commercial use, and may not be used for any purpose other than to identify prospective properties consumers may be interested in purchasing. Information is deemed reliable but not guaranteed.