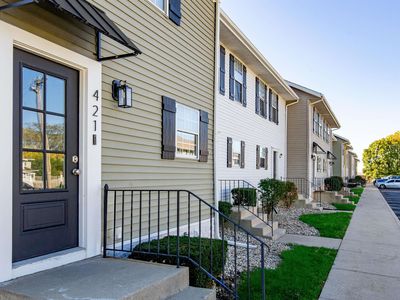
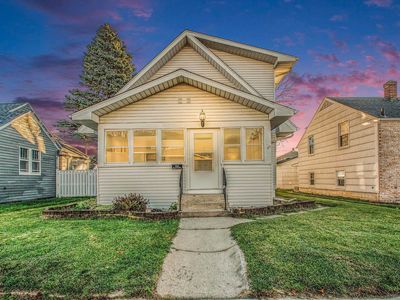
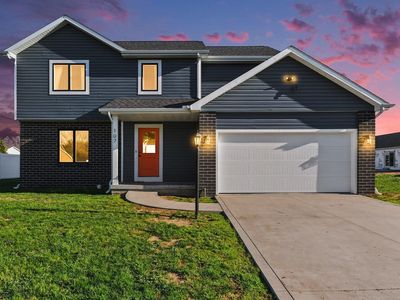
421 N Eddy St #1South BendIN46617

INVESTMENT ANALYSIS
Investment Verdict
Solid IncomeThe 8.38% yield at 421 N Eddy St #1, South Bend, IN, 46617 in South Bend is solid, but the $1,753/mo payment compresses net cash flow to $131/mo at $389,900. This is a tight-spread property, income covers debt, with little cushion. For investors who can optimise occupancy, the upside is real: 5% annual appreciation adds $107,722 by year five, and $3,591/yr in loan paydown builds equity. Ziffy Mortgage qualifies this via DSCR (1.55) without U.S. income documentation. Total projected return: $157,097.
| This Property | City Avg | |
|---|---|---|
| Gross Rental Yield | 8.4% | 5.8% |
| Monthly Cash Flow | $131 | $850 |
City averages based on South Bend market data in our database. Property projections are estimates.
DSCR Rental Loan Qualification
Qualifies using the property's rental income, not your personal income.
- ✓No W-2, pay stubs, or tax returns needed
- ✓Rental income qualifies you
- ✓Built for real estate investors
| Monthly Rental Income | $2,722 |
| Total Monthly Debt Service | $2,435 |
| DSCR Ratio | 1.12x |
Ziffy Mortgage: Your DSCR most likely meets our 1.0+ requirement, so you'll most probably qualify for our standard DSCR investment loan program. To pre-qualify, book time with your loan officer →
Estimates assume 6.0% rate / 30-yr fixed, 30% down, 1% tax, 0.5% insurance. Not a commitment to lend.
Townhouse
Built in 1990
880 sqft lot
$N/A/sqft
$250 monthly HOA
Neighborhood Data
Neighborhood data shown for ZIP Code: 46617, South Bend, IN area.
Housing Distribution
Housing Statistics
| Category | Value |
|---|---|
| Total HU (Housing Units) | 5,952 (100%) |
| Owner Occupied HU | 2,445 (41.1%) |
| Renter Occupied HU | 2,305 (38.7%) |
| Vacant Housing Units | 1,202 (20.2%) |
| Median Home Value | $267,663 |
| Average Home Value | $323,517 |
Housing Distribution
Address Breakdown
Residential
4,804
Single Family
3,675
Multi-Family
1,129
Businesses
341


Nearby investment properties with comparable rents
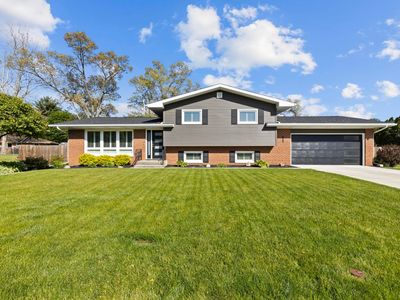

Nearby investment properties with comparable prices

Ziffy AI Summary
A quick, investor-focused snapshot highlighting income strength, yield potential.
| Key metrics | Value |
|---|---|
| Price | $399,900 |
| Est. Rent | $3,200/mo |
| ROI | 18% |
- Attractive rent-to-price ratio for income stability
- Good fit for DSCR financing with healthy coverage
Townhouse
Built in 1990
880 sqft lot
$N/A/sqft
$250 monthly HOA
Neighborhood Data
Neighborhood data shown for ZIP Code: 46617, South Bend, IN area.
Housing Distribution
Housing Statistics
| Category | Value |
|---|---|
| Total HU (Housing Units) | 5,952 (100%) |
| Owner Occupied HU | 2,445 (41.1%) |
| Renter Occupied HU | 2,305 (38.7%) |
| Vacant Housing Units | 1,202 (20.2%) |
| Median Home Value | $267,663 |
| Average Home Value | $323,517 |
Housing Distribution
Address Breakdown
Residential
4,804
Single Family
3,675
Multi-Family
1,129
Businesses
341
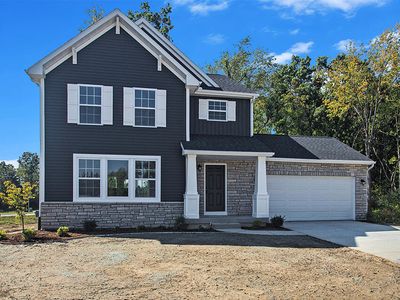
Nearby investment properties with comparable rents
Nearby investment properties with comparable prices
Listed by: Stephen C Smith • Irish Realty
Mls Name: IRMLS
Mls Provider:
Mls ID: #202606457
Disclaimer: IDX information is provided exclusively for personal, non-commercial use, and may not be used for any purpose other than to identify prospective properties consumers may be interested in purchasing. Information is deemed reliable but not guaranteed.