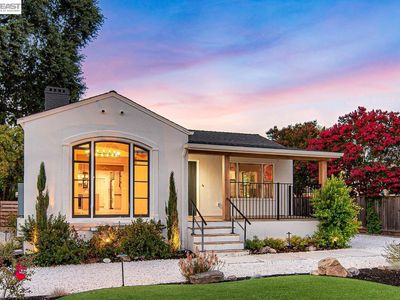
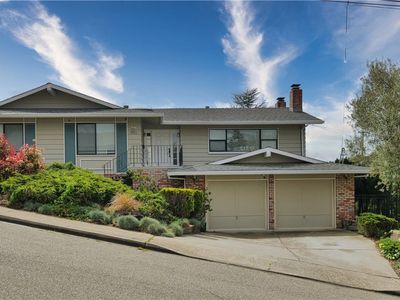
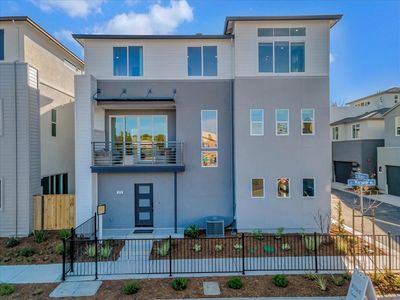
4073 Stanley BlvdPleasantonCA94566
INVESTMENT ANALYSIS
Investment Verdict
Appreciation PlayGlobal investors willing to prioritise equity over near-term yield will find 4073 Stanley Blvd, Pleasanton, CA, 94566 in Pleasanton worth study. Rental yield 4.21%. The 4.21% gross yield is below cash-flow benchmarks at $1,895,000, but 5% annual appreciation, adding $523,554 over five years, frames this as a capital growth position. Rent of $6,649/mo partially offsets the $8,521/mo payment. Ziffy Mortgage finances appreciation-play properties (0.78 DSCR) for non-U.S. residents without domestic income documentation; a 30–35% down payment maximises coverage. Total projected return: $392,061.
| This Property | City Avg | |
|---|---|---|
| Gross Rental Yield | 4.2% | 5.3% |
| Monthly Cash Flow | $(5,074) | $2,800 |
City averages based on Pleasanton market data in our database. Property projections are estimates.
DSCR Rental Loan Qualification
Qualifies using the property's rental income, not your personal income.
- ✓No W-2, pay stubs, or tax returns needed
- ✓Rental income qualifies you
- ✓Built for real estate investors
| Monthly Rental Income | $6,649 |
| Total Monthly Debt Service | $10,969 |
| DSCR Ratio | 0.61x |
Ziffy Mortgage typically prefers a DSCR of 1.0+, but in some cases you may qualify with a DSCR below 1. To explore if this deal qualifies for an investment mortgage, book time with your loan officer →
Estimates assume 6.0% rate / 30-yr fixed, 30% down, 1% tax, 0.5% insurance. Not a commitment to lend.
Single Family
Built in 1940
8,712 sqft lot
$N/A/sqft
No HOA
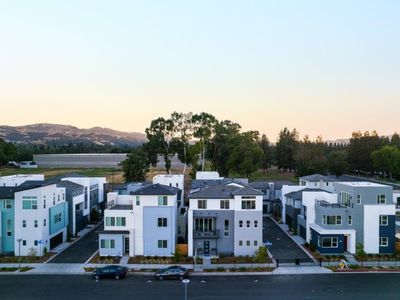
Neighborhood Data
Neighborhood data shown for ZIP Code: 94566, Pleasanton, CA area.
Housing Distribution
Housing Statistics
| Category | Value |
|---|---|
| Total HU (Housing Units) | 16,866 (100%) |
| Owner Occupied HU | 11,238 (66.6%) |
| Renter Occupied HU | 4,977 (29.5%) |
| Vacant Housing Units | 651 ( 3.9%) |
| Median Home Value | $1,664,555 |
| Average Home Value | $1,618,737 |
Housing Distribution
Address Breakdown
Residential
16,648
Single Family
13,782
Multi-Family
2,866
Businesses
2,116


Nearby investment properties with comparable rents
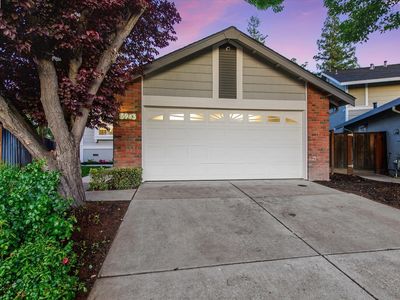

Nearby investment properties with comparable prices
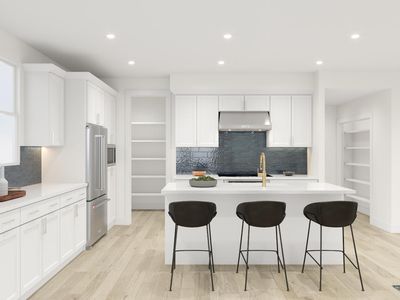

Ziffy AI Summary
A quick, investor-focused snapshot highlighting income strength, yield potential.
| Key metrics | Value |
|---|---|
| Price | $399,900 |
| Est. Rent | $3,200/mo |
| ROI | 18% |
- Attractive rent-to-price ratio for income stability
- Good fit for DSCR financing with healthy coverage
Single Family
Built in 1940
8,712 sqft lot
$N/A/sqft
No HOA
Neighborhood Data
Neighborhood data shown for ZIP Code: 94566, Pleasanton, CA area.
Housing Distribution
Housing Statistics
| Category | Value |
|---|---|
| Total HU (Housing Units) | 16,866 (100%) |
| Owner Occupied HU | 11,238 (66.6%) |
| Renter Occupied HU | 4,977 (29.5%) |
| Vacant Housing Units | 651 ( 3.9%) |
| Median Home Value | $1,664,555 |
| Average Home Value | $1,618,737 |
Housing Distribution
Address Breakdown
Residential
16,648
Single Family
13,782
Multi-Family
2,866
Businesses
2,116
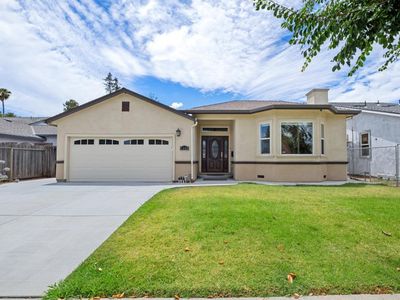
Nearby investment properties with comparable rents
Nearby investment properties with comparable prices
Listed by: Liz Venema • Keller Williams Tri-valley
Mls Name: Bay East AOR
Mls Provider:
Mls ID: #41127740
Disclaimer: Bay East 2026, CCAR 2026, bridgeMLS 2026. Information Deemed Reliable but not Guaranteed. This information is being provided by the Bay East MLS, or CCAR MLS, or bridgeMLS. The listings presented here may or may not be listed by the Broker/Agent operating this website. This information is intended for the personal use of consumers and may not be used or any purpose other than to identify prospective properties consumers may be interested in purchasing. Data last updated at 2026-04-30 03:28:18 PDT.