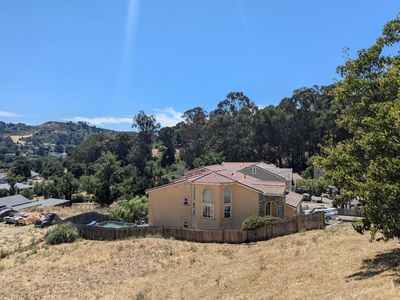
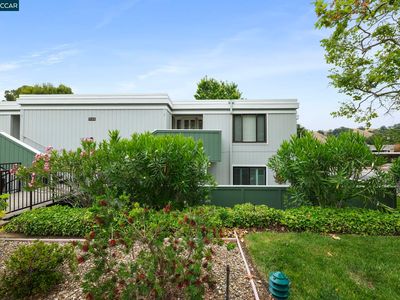
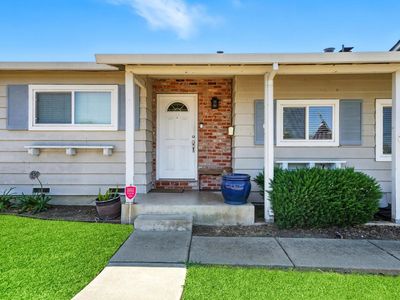
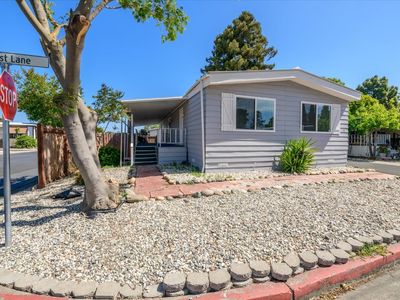
39 La Paloma CtEl SobranteCA94803
INVESTMENT ANALYSIS
Investment Verdict
Strong Cash Flow39 La Paloma Ct, El Sobrante, CA, 94803 in El Sobrante earns its strong cash-flow label: 24.03% yield, $4,306/mo rent, $2,927/mo net income, DSCR 4.45. The $215,000 acquisition cost produces immediate returns that put this property in the top tier for U.S. income assets accessible via Ziffy Mortgage's rental-income underwriting. Long-term, 5% annual appreciation adds $59,401 by year five. Combined with $1,980/yr in principal paydown, total projected return reaches $270,172.
| This Property | City Avg | |
|---|---|---|
| Gross Rental Yield | 24% | 7.0% |
| Monthly Cash Flow | $2,927 | $2,500 |
City averages based on El Sobrante market data in our database. Property projections are estimates.
DSCR Rental Loan Qualification
Qualifies using the property's rental income, not your personal income.
- ✓No W-2, pay stubs, or tax returns needed
- ✓Rental income qualifies you
- ✓Built for real estate investors
| Monthly Rental Income | $4,306 |
| Total Monthly Debt Service | $1,293 |
| DSCR Ratio | 3.33x |
Ziffy Mortgage: Your DSCR most likely meets our 1.0+ requirement, so you'll most probably qualify for our standard DSCR investment loan program. To pre-qualify, book time with your loan officer →
Estimates assume 6.0% rate / 30-yr fixed, 30% down, 1% tax, 0.5% insurance. Not a commitment to lend.
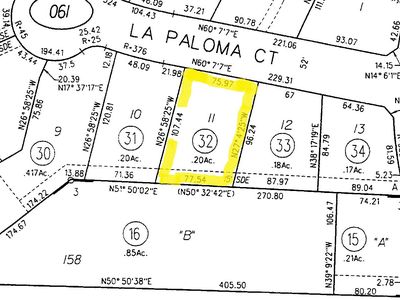
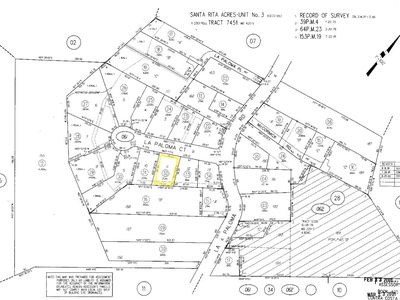
Lot
Built in N/A
8,712 sqft lot
$N/A/sqft
No HOA
Neighborhood Data
Neighborhood data shown for ZIP Code: 94803, El Sobrante, CA area.
Housing Distribution
Housing Statistics
| Category | Value |
|---|---|
| Total HU (Housing Units) | 9,745 (100%) |
| Owner Occupied HU | 6,564 (67.4%) |
| Renter Occupied HU | 2,766 (28.4%) |
| Vacant Housing Units | 415 ( 4.3%) |
| Median Home Value | $812,573 |
| Average Home Value | $917,555 |
Housing Distribution
Address Breakdown
Residential
9,595
Single Family
8,115
Multi-Family
1,480
Businesses
356


Nearby investment properties with comparable rents
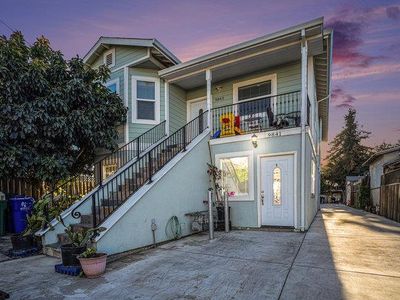

Nearby investment properties with comparable prices
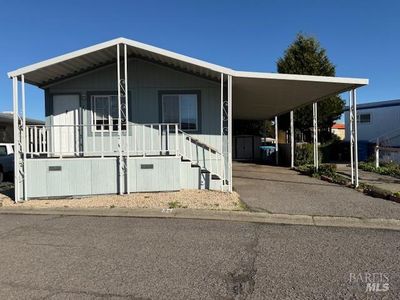
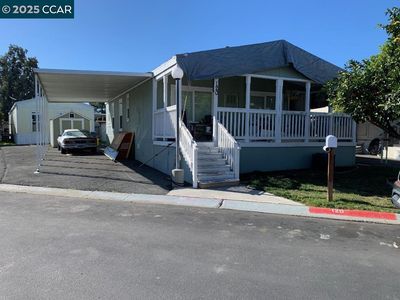

Ziffy AI Summary
A quick, investor-focused snapshot highlighting income strength, yield potential.
| Key metrics | Value |
|---|---|
| Price | $399,900 |
| Est. Rent | $3,200/mo |
| ROI | 18% |
- Attractive rent-to-price ratio for income stability
- Good fit for DSCR financing with healthy coverage
Lot
Built in N/A
8,712 sqft lot
$N/A/sqft
No HOA
Neighborhood Data
Neighborhood data shown for ZIP Code: 94803, El Sobrante, CA area.
Housing Distribution
Housing Statistics
| Category | Value |
|---|---|
| Total HU (Housing Units) | 9,745 (100%) |
| Owner Occupied HU | 6,564 (67.4%) |
| Renter Occupied HU | 2,766 (28.4%) |
| Vacant Housing Units | 415 ( 4.3%) |
| Median Home Value | $812,573 |
| Average Home Value | $917,555 |
Housing Distribution
Address Breakdown
Residential
9,595
Single Family
8,115
Multi-Family
1,480
Businesses
356
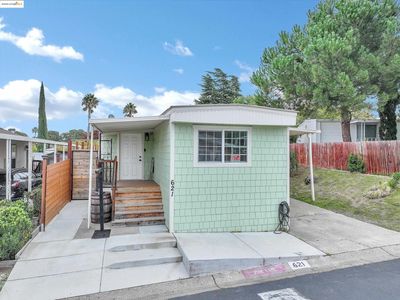
Nearby investment properties with comparable rents
Nearby investment properties with comparable prices
Listed by: Phil Roza • Realty World Dominion
Mls Name: MLSListings Inc
Mls Provider:
Mls ID: #ML81976169
Disclaimer: Based on information from the MLSListings MLS as of 2024-08-15 16:27:41 PDT. All data, including all measurements and calculations of area, is obtained from various sources and has not been, and will not be, verified by broker or MLS. All information should be independently reviewed and verified for accuracy. Properties may or may not be listed by the office/agent presenting the information.