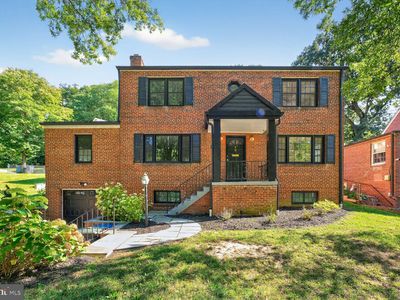
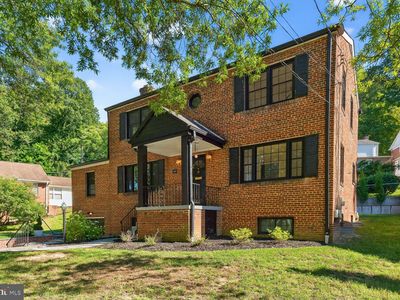
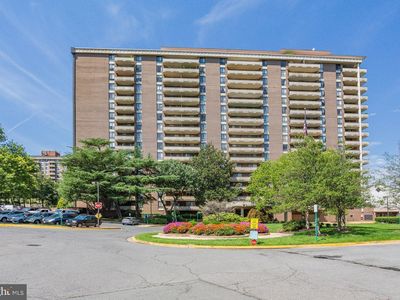
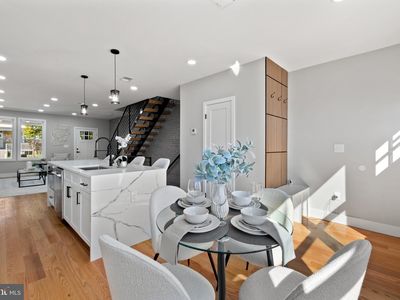
3729 Carpenter St SEWashingtonDC20020
INVESTMENT ANALYSIS
Investment Verdict
Appreciation PlayMarkets with strong demand fundamentals often produce low-yield, high-appreciation assets. 3729 Carpenter St SE, Washington, DC, 20020 in Washington fits: $985,000, 5.55% gross yield, and a projected 5% annual appreciation rate adding $272,137 in value within five years. Rental yield 5.55%. The narrow rent-to-debt spread is the trade-off for market growth. Ziffy Mortgage's DSCR loan (1.03) finances non-U.S. buyers without personal income documentation; optimise coverage with a 30–35% down payment. $9,072/yr in principal paydown and $272,137 in appreciation project a total return of $294,444.
| This Property | City Avg | |
|---|---|---|
| Gross Rental Yield | 5.6% | 5.2% |
| Monthly Cash Flow | $(1,207) | $1,200 |
City averages based on Washington market data in our database. Property projections are estimates.
DSCR Loan Qualification
| Monthly Rental Income | $4,558 |
| Total Monthly Debt Service | $5,373 |
| DSCR Ratio | 0.85x |
Ziffy Mortgage typically prefers a DSCR of 1.0+, but in some cases you may qualify with a DSCR below 1. To explore if this deal qualifies for an investment mortgage, book time with your loan officer →
Estimates assume 6.0% rate / 30-yr fixed, 30% down, 1% tax, 0.5% insurance. Not a commitment to lend.
Single Family
Built in 1953
5,360 sqft lot
$N/A/sqft
No HOA
Neighborhood Data
Neighborhood data shown for ZIP Code: 20020, Washington, DC area.
Housing Distribution
Housing Statistics
| Category | Value |
|---|---|
| Total HU (Housing Units) | 24,460 (100%) |
| Owner Occupied HU | 6,831 (27.9%) |
| Renter Occupied HU | 15,173 (62.0%) |
| Vacant Housing Units | 2,456 (10.0%) |
| Median Home Value | $436,983 |
| Average Home Value | $485,945 |
Housing Distribution
Address Breakdown
Residential
23,175
Single Family
12,130
Multi-Family
11,045
Businesses
706


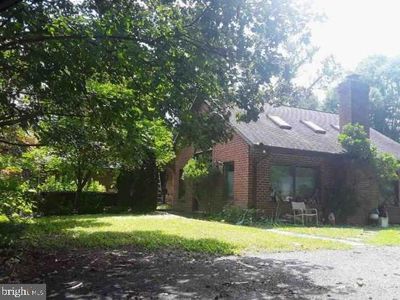
Nearby investment properties with comparable rents
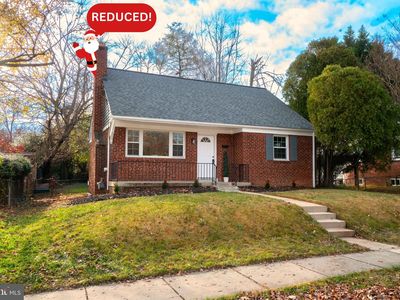
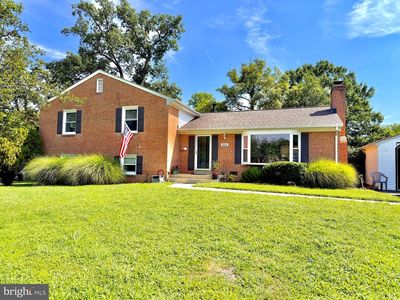
Nearby investment properties with comparable prices


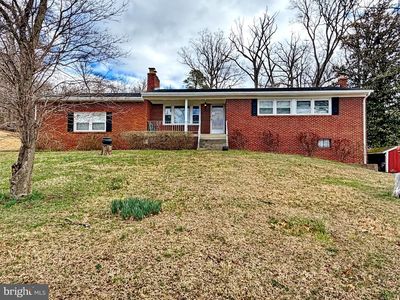
Ziffy AI Summary
A quick, investor-focused snapshot highlighting income strength, yield potential.
| Key metrics | Value |
|---|---|
| Price | $399,900 |
| Est. Rent | $3,200/mo |
| ROI | 18% |
- Attractive rent-to-price ratio for income stability
- Good fit for DSCR financing with healthy coverage
Single Family
Built in 1953
5,360 sqft lot
$N/A/sqft
No HOA
Neighborhood Data
Neighborhood data shown for ZIP Code: 20020, Washington, DC area.
Housing Distribution
Housing Statistics
| Category | Value |
|---|---|
| Total HU (Housing Units) | 24,460 (100%) |
| Owner Occupied HU | 6,831 (27.9%) |
| Renter Occupied HU | 15,173 (62.0%) |
| Vacant Housing Units | 2,456 (10.0%) |
| Median Home Value | $436,983 |
| Average Home Value | $485,945 |
Housing Distribution
Address Breakdown
Residential
23,175
Single Family
12,130
Multi-Family
11,045
Businesses
706
Nearby investment properties with comparable rents
Nearby investment properties with comparable prices
Listed by: Andy Biggers • KW United
Mls Name: Bright MLS
Mls ID: #DCDC2222582