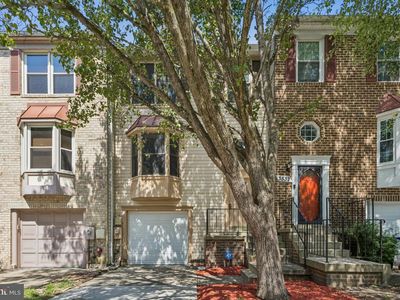
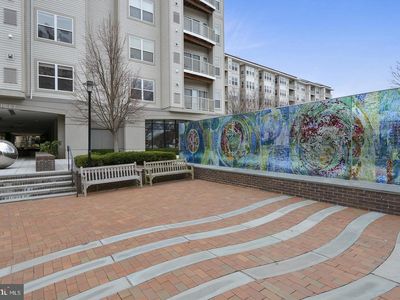
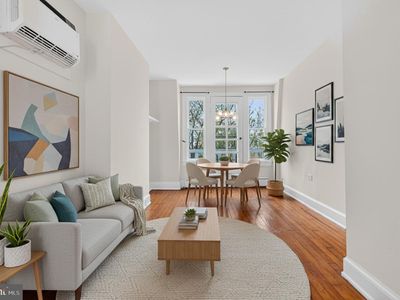
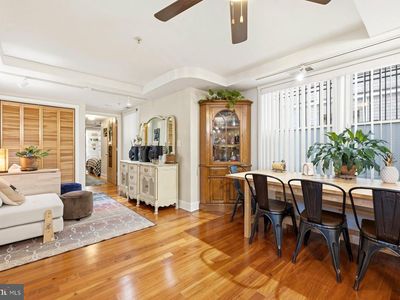
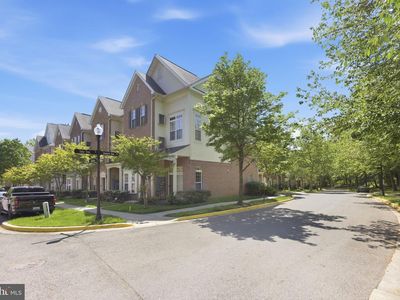
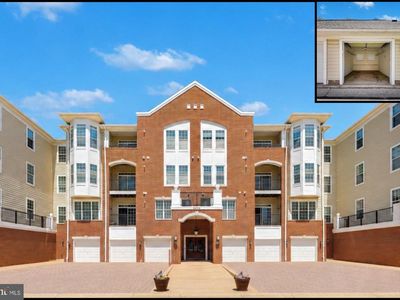
3539 Emperor CtBowieMD20716
INVESTMENT ANALYSIS
Investment Verdict
Solid IncomeSolid, durable, and financeable, 3539 Emperor Ct, Bowie, MD, 20716 in Bowie earns a 8.24% gross yield at $425,000. Rent of $2,917/mo nets $274/mo after the $1,911/mo mortgage. The 1.53 DSCR signals clean DSCR underwriting through Ziffy Mortgage, with no personal income verification required. Five-year value growth of $117,420 and $3,914/yr in equity accumulation project a total cumulative return of $178,823.
| This Property | City Avg | |
|---|---|---|
| Gross Rental Yield | 8.2% | 5.1% |
| Monthly Cash Flow | $274 | $1,850 |
City averages based on Bowie market data in our database. Property projections are estimates.
DSCR Rental Loan Qualification
Qualifies using the property's rental income, not your personal income.
- ✓No W-2, pay stubs, or tax returns needed
- ✓Rental income qualifies you
- ✓Built for real estate investors
| Monthly Rental Income | $2,917 |
| Total Monthly Debt Service | $2,474 |
| DSCR Ratio | 1.18x |
Ziffy Mortgage: Your DSCR most likely meets our 1.0+ requirement, so you'll most probably qualify for our standard DSCR investment loan program. To pre-qualify, book time with your loan officer →
Estimates assume 6.0% rate / 30-yr fixed, 30% down, 1% tax, 0.5% insurance. Not a commitment to lend.
Townhouse
Built in 1989
1,510 sqft lot
$N/A/sqft
No HOA
Neighborhood Data
Neighborhood data shown for ZIP Code: 20716, Bowie, MD area.
Housing Distribution
Housing Statistics
| Category | Value |
|---|---|
| Total HU (Housing Units) | 9,953 (100%) |
| Owner Occupied HU | 6,593 (66.2%) |
| Renter Occupied HU | 2,882 (29.0%) |
| Vacant Housing Units | 478 ( 4.8%) |
| Median Home Value | $454,615 |
| Average Home Value | $488,465 |
Housing Distribution
Address Breakdown
Residential
9,484
Single Family
7,346
Multi-Family
2,138
Businesses
490


Nearby investment properties with comparable rents
Nearby investment properties with comparable prices

Ziffy AI Summary
A quick, investor-focused snapshot highlighting income strength, yield potential.
| Key metrics | Value |
|---|---|
| Price | $399,900 |
| Est. Rent | $3,200/mo |
| ROI | 18% |
- Attractive rent-to-price ratio for income stability
- Good fit for DSCR financing with healthy coverage
Townhouse
Built in 1989
1,510 sqft lot
$N/A/sqft
No HOA
Neighborhood Data
Neighborhood data shown for ZIP Code: 20716, Bowie, MD area.
Housing Distribution
Housing Statistics
| Category | Value |
|---|---|
| Total HU (Housing Units) | 9,953 (100%) |
| Owner Occupied HU | 6,593 (66.2%) |
| Renter Occupied HU | 2,882 (29.0%) |
| Vacant Housing Units | 478 ( 4.8%) |
| Median Home Value | $454,615 |
| Average Home Value | $488,465 |
Housing Distribution
Address Breakdown
Residential
9,484
Single Family
7,346
Multi-Family
2,138
Businesses
490
Nearby investment properties with comparable rents
Nearby investment properties with comparable prices