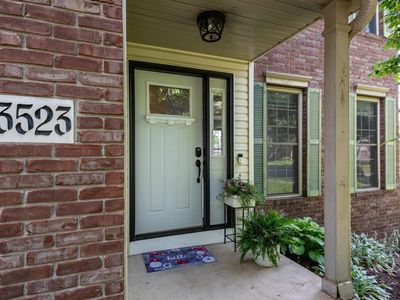
3523 S Tulip AveBloomingtonIN47403


Nearby investment properties with comparable rents

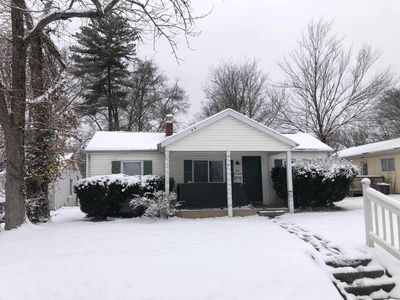


Nearby investment properties with comparable prices


Ziffy AI Summary
A quick, investor-focused snapshot highlighting income strength, yield potential.
| Key metrics | Value |
|---|---|
| Price | $399,900 |
| Est. Rent | $3,200/mo |
| ROI | 18% |
- Attractive rent-to-price ratio for income stability
- Good fit for DSCR financing with healthy coverage
Investment Highlights
Rental property for sale in Bloomington at 3523 S Tulip Ave, Bloomington, IN, 47403 generates $2,175/mo in rent, after a $2,031/mo payment. Total monthly income is $2,175/mo. Return on cash invested sits at 16.96% in year one, and rental yield is 6.29% on a $415,000 entry. Equity gained on principal adds $2,678/yr, while 5% annual appreciation builds toward $114,657 over five years. Five-year ROI reaches 86.84% and total cumulative return in cash sums $119,469. For financing, investors can use Ziffy Mortgage’s DSCR loan, which considers $2,175/mo property income rather than buyer’s personal income.
Single Family
Built in 1997
0.25 Acres lot
$N/A/sqft
$270 annually HOA
Neighborhood Data
Neighborhood data shown for ZIP Code: 47403, Bloomington, IN area.
Housing Distribution
Housing Statistics
| Category | Value |
|---|---|
| Total HU (Housing Units) | 16,220 (100%) |
| Owner Occupied HU | 8,232 (50.8%) |
| Renter Occupied HU | 6,740 (41.6%) |
| Vacant Housing Units | 1,248 ( 7.7%) |
| Median Home Value | $274,404 |
| Average Home Value | $300,479 |
Housing Distribution
Address Breakdown
Residential
15,959
Single Family
14,167
Multi-Family
1,792
Businesses
591
Nearby investment properties with comparable rents
Nearby investment properties with comparable prices
Listed by: Lyndsey Abdelkader • Sycamore Real Estate Group
Mls Name: IRMLS
Mls Provider:
Mls ID: #202524625
Disclaimer: IDX information is provided exclusively for personal, non-commercial use, and may not be used for any purpose other than to identify prospective properties consumers may be interested in purchasing. Information is deemed reliable but not guaranteed.