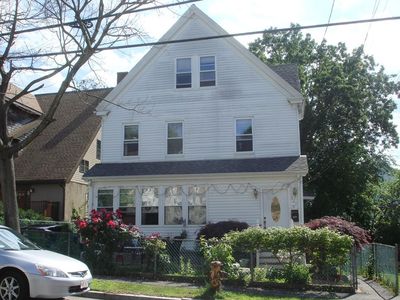
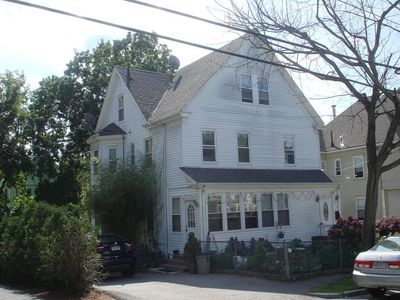
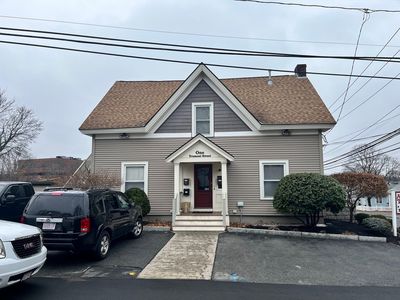
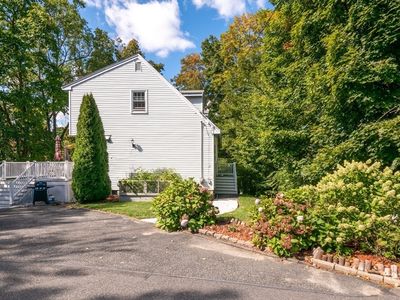
323 Farrington StQuincyMA02170


Nearby investment properties with comparable rents
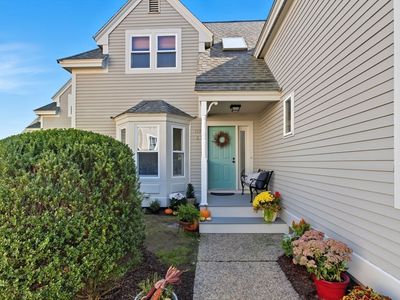
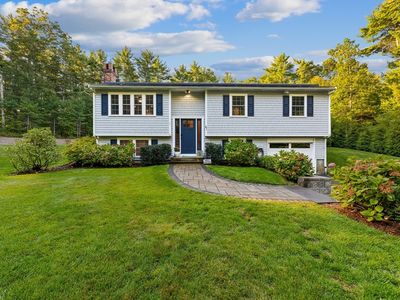
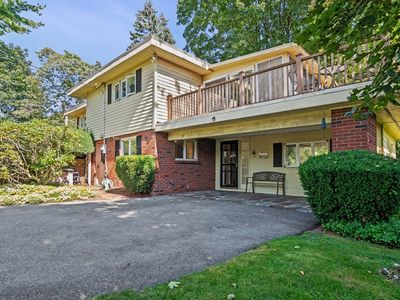
Nearby investment properties with comparable prices


Ziffy AI Summary
A quick, investor-focused snapshot highlighting income strength, yield potential.
| Key metrics | Value |
|---|---|
| Price | $399,900 |
| Est. Rent | $3,200/mo |
| ROI | 18% |
- Attractive rent-to-price ratio for income stability
- Good fit for DSCR financing with healthy coverage
Investment Highlights
Rental property for sale in Quincy at 323 Farrington St, Quincy, MA, 02170 offers $5,758/mo rent that, after a $4,264/mo payment, leaves $267/mo cash flow. Total monthly income is $5,758/mo, and annual cash flow is $3,205/yr on $286,625 cash. Return on cash invested measures 21.18% in year one, and rental yield stands at 7.93% at a $871,200 entry. Equity gained on principal adds $5,622/yr while 5% annual appreciation compounds into $240,697 by year five. Five-year ROI records 109.78% and total cumulative return in cash reaches $314,646. Lending can use Ziffy Mortgage’s DSCR loan, which structures approval around $5,758/mo property income versus a $4,264/mo payment rather than borrower’s personal income verification through W2s, Salary slips, and Tax returns.
Single Family
Built in 1915
4,791 sqft lot
$N/A/sqft
No HOA
Neighborhood Data
Neighborhood data shown for ZIP Code: 02170, Quincy, MA area.
Housing Distribution
Housing Statistics
| Category | Value |
|---|---|
| Total HU (Housing Units) | 7,943 (100%) |
| Owner Occupied HU | 4,085 (51.4%) |
| Renter Occupied HU | 3,544 (44.6%) |
| Vacant Housing Units | 314 ( 4.0%) |
| Median Home Value | $701,352 |
| Average Home Value | $792,440 |
Housing Distribution
Address Breakdown
Residential
7,880
Single Family
5,807
Multi-Family
2,073
Businesses
330
Nearby investment properties with comparable rents
Nearby investment properties with comparable prices
Listed by: N/A • N/A
Mls Name: undefined
Mls ID: #N/A