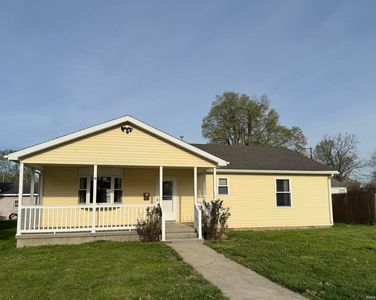
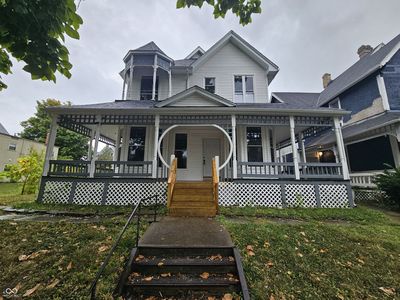
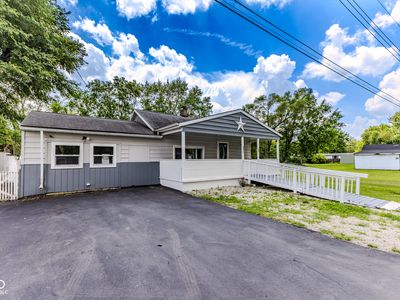
3202 S Pershing DrMuncieIN47302
INVESTMENT ANALYSIS
Investment Verdict
Strong Cash FlowStrong cash flow defines 3202 S Pershing Dr, Muncie, IN, 47302 in Muncie: $1,389/mo in rent, $519/mo net, 11.5% gross yield, all on a $145,000 acquisition. The 2.13 coverage ratio comfortably clears Ziffy Mortgage's threshold, enabling foreign-national buyers to close without U.S. credit documentation. Over five years, 5% appreciation adds $40,061 in value, and $1,335/yr in principal paydown steadily builds equity. Projected total cumulative return: $88,282.
| This Property | City Avg | |
|---|---|---|
| Gross Rental Yield | 11.5% | 6.8% |
| Monthly Cash Flow | $519 | $450 |
City averages based on Muncie market data in our database. Property projections are estimates.
DSCR Loan Qualification
| Monthly Rental Income | $1,389 |
| Total Monthly Debt Service | $813 |
| DSCR Ratio | 1.71x |
Ziffy Mortgage: Your DSCR most likely meets our 1.0+ requirement, so you'll most probably qualify for our standard DSCR investment loan program. To pre-qualify, book time with your loan officer →
Estimates assume 6.0% rate / 30-yr fixed, 30% down, 1% tax, 0.5% insurance. Not a commitment to lend.
Single Family
Built in 2014
0.25 Acres lot
$N/A/sqft
No HOA
Neighborhood Data
Neighborhood data shown for ZIP Code: 47302, Muncie, IN area.
Housing Distribution
Housing Statistics
| Category | Value |
|---|---|
| Total HU (Housing Units) | 12,894 (100%) |
| Owner Occupied HU | 7,150 (55.5%) |
| Renter Occupied HU | 3,985 (30.9%) |
| Vacant Housing Units | 1,759 (13.6%) |
| Median Home Value | $89,088 |
| Average Home Value | $153,660 |
Housing Distribution
Address Breakdown
Residential
11,508
Single Family
11,429
Multi-Family
79
Businesses
580


Nearby investment properties with comparable rents

Nearby investment properties with comparable prices

Ziffy AI Summary
A quick, investor-focused snapshot highlighting income strength, yield potential.
| Key metrics | Value |
|---|---|
| Price | $399,900 |
| Est. Rent | $3,200/mo |
| ROI | 18% |
- Attractive rent-to-price ratio for income stability
- Good fit for DSCR financing with healthy coverage
Single Family
Built in 2014
0.25 Acres lot
$N/A/sqft
No HOA
Neighborhood Data
Neighborhood data shown for ZIP Code: 47302, Muncie, IN area.
Housing Distribution
Housing Statistics
| Category | Value |
|---|---|
| Total HU (Housing Units) | 12,894 (100%) |
| Owner Occupied HU | 7,150 (55.5%) |
| Renter Occupied HU | 3,985 (30.9%) |
| Vacant Housing Units | 1,759 (13.6%) |
| Median Home Value | $89,088 |
| Average Home Value | $153,660 |
Housing Distribution
Address Breakdown
Residential
11,508
Single Family
11,429
Multi-Family
79
Businesses
580
Nearby investment properties with comparable rents
Nearby investment properties with comparable prices
Listed by: Annette Caldwell • RE/MAX at the Crossing.
Mls Name: IRMLS
Mls Provider:
Mls ID: #202514492
Disclaimer: IDX information is provided exclusively for personal, non-commercial use, and may not be used for any purpose other than to identify prospective properties consumers may be interested in purchasing. Information is deemed reliable but not guaranteed.