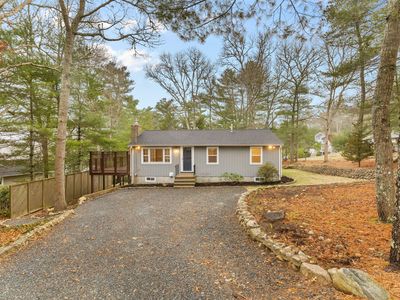
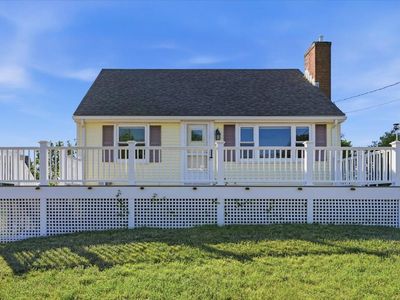
3 Compass CircleEast FalmouthMA02536
INVESTMENT ANALYSIS
Investment Verdict
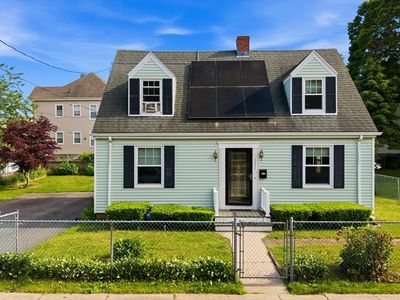
Appreciation Play3 Compass Circle, East Falmouth, MA, 02536 in East Falmouth is priced for appreciation, not yield. Rental yield 5.48%. At $699,900 with a 5.48% gross yield, the monthly income is modest, but 5% annual price growth is projected to add $193,369 in value over five years, making equity the primary return driver. Ziffy Mortgage's DSCR mortgage (1.04) can still finance this property for non-U.S. residents; a 30–35% down payment typically produces the cleanest underwriting for appreciation-focused assets. Total projected cumulative return: $192,593.
| This Property | City Avg | |
|---|---|---|
| Gross Rental Yield | 5.5% | 7.2% |
| Monthly Cash Flow | $(1,215) | $850 |
City averages based on East Falmouth market data in our database. Property projections are estimates.
DSCR Rental Loan Qualification
Qualifies using the property's rental income, not your personal income.
- ✓No W-2, pay stubs, or tax returns needed
- ✓Rental income qualifies you
- ✓Built for real estate investors
| Monthly Rental Income | $3,274 |
| Total Monthly Debt Service | $4,133 |
| DSCR Ratio | 0.79x |
Ziffy Mortgage typically prefers a DSCR of 1.0+, but in some cases you may qualify with a DSCR below 1. To explore if this deal qualifies for an investment mortgage, book time with your loan officer →
Estimates assume 6.0% rate / 30-yr fixed, 30% down, 1% tax, 0.5% insurance. Not a commitment to lend.
Single Family
Built in 1971
0.30 Acres lot
$N/A/sqft
No HOA
Neighborhood Data
Neighborhood data shown for ZIP Code: 02536, East Falmouth, MA area.
Housing Distribution
Housing Statistics
| Category | Value |
|---|---|
| Total HU (Housing Units) | 12,923 (100%) |
| Owner Occupied HU | 7,193 (55.7%) |
| Renter Occupied HU | 1,551 (12.0%) |
| Vacant Housing Units | 4,179 (32.3%) |
| Median Home Value | $703,795 |
| Average Home Value | $801,507 |
Housing Distribution
Address Breakdown
Residential
11,643
Single Family
11,560
Multi-Family
83
Businesses
410


Nearby investment properties with comparable rents
Nearby investment properties with comparable prices

Ziffy AI Summary
A quick, investor-focused snapshot highlighting income strength, yield potential.
| Key metrics | Value |
|---|---|
| Price | $399,900 |
| Est. Rent | $3,200/mo |
| ROI | 18% |
- Attractive rent-to-price ratio for income stability
- Good fit for DSCR financing with healthy coverage
Single Family
Built in 1971
0.30 Acres lot
$N/A/sqft
No HOA
Neighborhood Data
Neighborhood data shown for ZIP Code: 02536, East Falmouth, MA area.
Housing Distribution
Housing Statistics
| Category | Value |
|---|---|
| Total HU (Housing Units) | 12,923 (100%) |
| Owner Occupied HU | 7,193 (55.7%) |
| Renter Occupied HU | 1,551 (12.0%) |
| Vacant Housing Units | 4,179 (32.3%) |
| Median Home Value | $703,795 |
| Average Home Value | $801,507 |
Housing Distribution
Address Breakdown
Residential
11,643
Single Family
11,560
Multi-Family
83
Businesses
410
Nearby investment properties with comparable rents
Nearby investment properties with comparable prices
Listed by: Melissa Wagner • Keller Williams Elite
Mls Name: CCIMLS
Mls Provider:
Mls ID: #22501422
Disclaimer: All data relating to real estate for sale on this page comes from the Broker Reciprocity (BR) of the Cape Cod & Islands Multiple Listing Service, Inc. Detailed information about real estate listings held by brokerage firms other than CC&I Assoc. of REALTORS, Inc. includes the name of the listing company. Neither the listing company nor CC&I Assoc. of REALTORS, Inc. shall be responsible for any typographical errors, misinformation, misprints and shall be held totally harmless. The Broker providing this data believes it to be correct, but advises interested parties to confirm any item before relying on it in a purchase decision. This site was last updated 2022-04-05 08:58:10 PDT. All properties are subject to prior sale, changes, or withdrawal. Copyright 2022 Cape Cod & Islands Multiple Listing Service, Inc. All rights reserved.