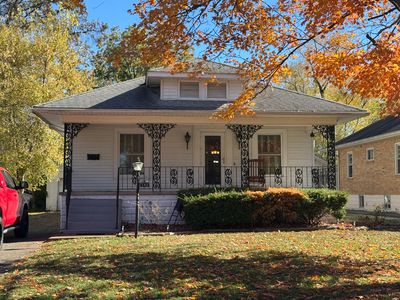
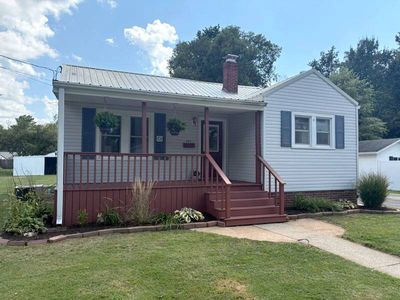
296 N Bennington RdOlneyIL62450


INVESTMENT ANALYSIS
Investment Verdict
Solid IncomeTight but positive: 296 N Bennington Rd, Olney, IL, 62450 in Olney at $150,000 earns $1,110/mo in rent and nets $0/mo after the $674/mo payment, a 8.33% yield with limited short-term income headroom. The equity story offsets the thin monthly spread: 5% annual appreciation adds $41,442 over five years. Ziffy Mortgage underwrites this on a 1.65 DSCR without U.S. credit history. With $1,382/yr in principal paydown, total projected return reaches $61,892.
| This Property | City Avg | |
|---|---|---|
| Gross Rental Yield | 8.3% | 7.0% |
| Monthly Cash Flow | $0 | $150 |
City averages based on Olney market data in our database. Property projections are estimates.
DSCR Loan Qualification
| Monthly Rental Income | $1,110 |
| Total Monthly Debt Service | $981 |
| DSCR Ratio | 1.13x |
Ziffy Mortgage: Your DSCR most likely meets our 1.0+ requirement, so you'll most probably qualify for our standard DSCR investment loan program. To pre-qualify, book time with your loan officer →
Estimates assume 6.0% rate / 30-yr fixed, 30% down, 1% tax, 0.5% insurance. Not a commitment to lend.
Single Family
Built in 1940
2.20 Acres lot
$N/A/sqft
No HOA
Neighborhood Data
Neighborhood data shown for ZIP Code: 62450, Olney, IL area.
Housing Distribution
Housing Statistics
| Category | Value |
|---|---|
| Total HU (Housing Units) | 5,685 (100%) |
| Owner Occupied HU | 3,543 (62.3%) |
| Renter Occupied HU | 1,489 (26.2%) |
| Vacant Housing Units | 653 (11.5%) |
| Median Home Value | $140,262 |
| Average Home Value | $187,316 |
Housing Distribution
Address Breakdown
Residential
5,301
Single Family
5,087
Multi-Family
214
Businesses
558


Nearby investment properties with comparable rents
Nearby investment properties with comparable prices

Ziffy AI Summary
A quick, investor-focused snapshot highlighting income strength, yield potential.
| Key metrics | Value |
|---|---|
| Price | $399,900 |
| Est. Rent | $3,200/mo |
| ROI | 18% |
- Attractive rent-to-price ratio for income stability
- Good fit for DSCR financing with healthy coverage
Single Family
Built in 1940
2.20 Acres lot
$N/A/sqft
No HOA
Neighborhood Data
Neighborhood data shown for ZIP Code: 62450, Olney, IL area.
Housing Distribution
Housing Statistics
| Category | Value |
|---|---|
| Total HU (Housing Units) | 5,685 (100%) |
| Owner Occupied HU | 3,543 (62.3%) |
| Renter Occupied HU | 1,489 (26.2%) |
| Vacant Housing Units | 653 (11.5%) |
| Median Home Value | $140,262 |
| Average Home Value | $187,316 |
Housing Distribution
Address Breakdown
Residential
5,301
Single Family
5,087
Multi-Family
214
Businesses
558
Nearby investment properties with comparable rents
Nearby investment properties with comparable prices
