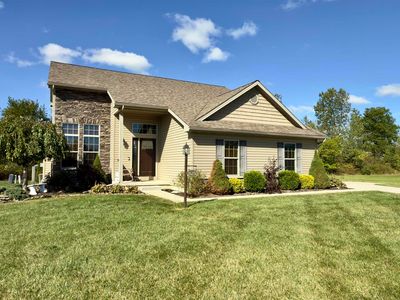
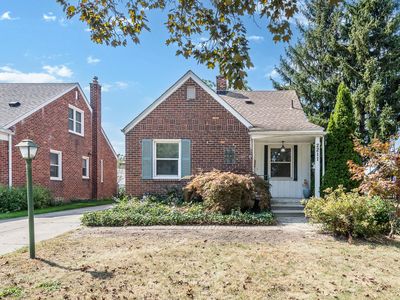
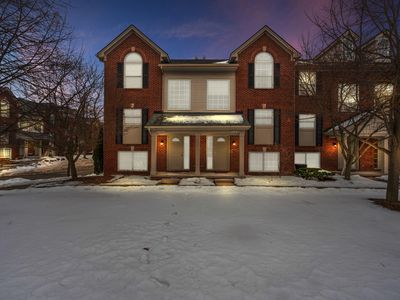
26250 Territorial Crossing RdNew BostonMI48164

INVESTMENT ANALYSIS
Investment Verdict
Solid IncomeAt $374,900, 26250 Territorial Crossing Rd, New Boston, MI, 48164 in New Boston generates $2,501/mo in rent (8% yield) but nets only $29/mo after debt service. The spread is thin, manageable for investors comfortable with low-margin holds who are buying into the 5% annual appreciation thesis. Ziffy Mortgage's DSCR loan (1.48) allows non-U.S. residents to acquire without personal income checks. A larger down payment reduces the monthly debt load and widens the margin. Five-year appreciation: $103,578. Total projected return: $144,671.
| This Property | City Avg | |
|---|---|---|
| Gross Rental Yield | 8% | 6.5% |
| Monthly Cash Flow | $29 | $650 |
City averages based on New Boston market data in our database. Property projections are estimates.
DSCR Rental Loan Qualification
Qualifies using the property's rental income, not your personal income.
- ✓No W-2, pay stubs, or tax returns needed
- ✓Rental income qualifies you
- ✓Built for real estate investors
| Monthly Rental Income | $2,501 |
| Total Monthly Debt Service | $2,323 |
| DSCR Ratio | 1.08x |
Ziffy Mortgage: Your DSCR most likely meets our 1.0+ requirement, so you'll most probably qualify for our standard DSCR investment loan program. To pre-qualify, book time with your loan officer →
Estimates assume 6.0% rate / 30-yr fixed, 30% down, 1% tax, 0.5% insurance. Not a commitment to lend.
Single Family
Built in 2016
9,147 sqft lot
$N/A/sqft
No HOA
Neighborhood Data
Neighborhood data shown for ZIP Code: 48164, New Boston, MI area.
Housing Distribution
Housing Statistics
| Category | Value |
|---|---|
| Total HU (Housing Units) | 3,650 (100%) |
| Owner Occupied HU | 3,244 (88.9%) |
| Renter Occupied HU | 275 ( 7.5%) |
| Vacant Housing Units | 131 ( 3.6%) |
| Median Home Value | $331,699 |
| Average Home Value | $334,306 |
Housing Distribution
Address Breakdown
Residential
3,822
Single Family
3,822
Multi-Family
0
Businesses
197


Nearby investment properties with comparable rents
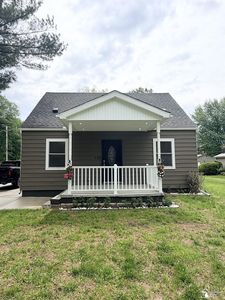

Nearby investment properties with comparable prices

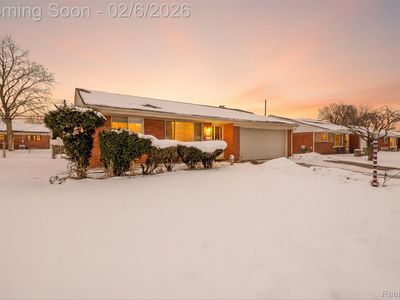
Ziffy AI Summary
A quick, investor-focused snapshot highlighting income strength, yield potential.
| Key metrics | Value |
|---|---|
| Price | $399,900 |
| Est. Rent | $3,200/mo |
| ROI | 18% |
- Attractive rent-to-price ratio for income stability
- Good fit for DSCR financing with healthy coverage
Single Family
Built in 2016
9,147 sqft lot
$N/A/sqft
No HOA
Neighborhood Data
Neighborhood data shown for ZIP Code: 48164, New Boston, MI area.
Housing Distribution
Housing Statistics
| Category | Value |
|---|---|
| Total HU (Housing Units) | 3,650 (100%) |
| Owner Occupied HU | 3,244 (88.9%) |
| Renter Occupied HU | 275 ( 7.5%) |
| Vacant Housing Units | 131 ( 3.6%) |
| Median Home Value | $331,699 |
| Average Home Value | $334,306 |
Housing Distribution
Address Breakdown
Residential
3,822
Single Family
3,822
Multi-Family
0
Businesses
197
Nearby investment properties with comparable rents
Nearby investment properties with comparable prices
Listed by: Jack Giarmo • Coldwell Banker Haynes R.E. in Monroe
Mls Name: MiRealSource
Mls ID: #50190212