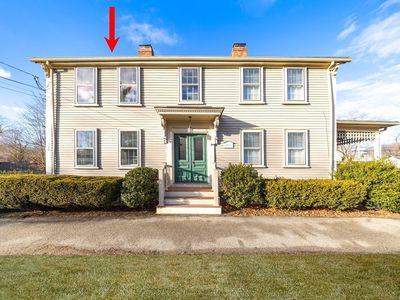
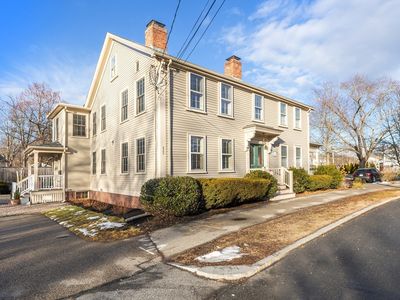
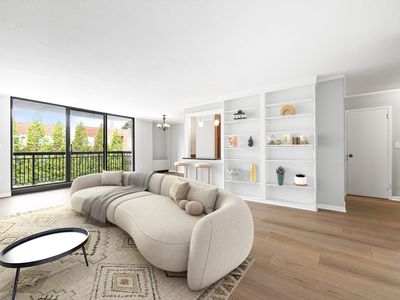
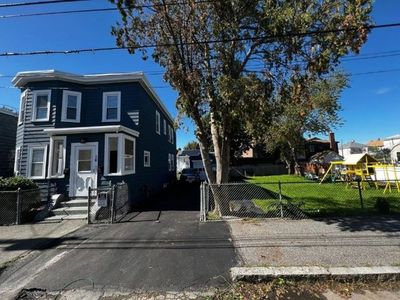
225 South St #1HinghamMA02043


Nearby investment properties with comparable rents
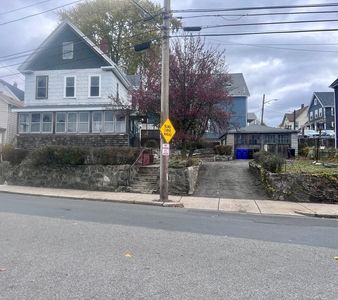
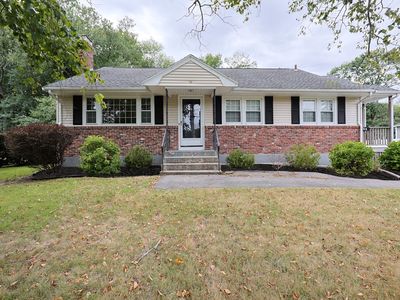
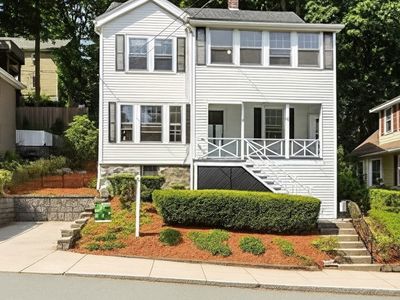
Nearby investment properties with comparable prices


Ziffy AI Summary
A quick, investor-focused snapshot highlighting income strength, yield potential.
| Key metrics | Value |
|---|---|
| Price | $399,900 |
| Est. Rent | $3,200/mo |
| ROI | 18% |
- Attractive rent-to-price ratio for income stability
- Good fit for DSCR financing with healthy coverage
Investment Highlights
Total monthly income runs $4,914/mo, and a $5,379/mo payment. Purchase price stands at $1,099,000, and rental yield measures 5.37% with $4,914/mo rent. Return on cash invested shows 13.59% in year one, and 5% annual appreciation builds toward $303,633 over five years. Five-year ROI reaches 69% and total cumulative return in cash records $245,694. Financing may use Ziffy Mortgage’s DSCR loan, which bases approval on $4,914/mo property income covering a $5,379/mo payment rather than investor’s personal income.
Condo
Built in 1880
8,712 sqft lot
$N/A/sqft
No HOA
Neighborhood Data
Neighborhood data shown for ZIP Code: 02043, Hingham, MA area.
Housing Distribution
Housing Statistics
| Category | Value |
|---|---|
| Total HU (Housing Units) | 10,276 (100%) |
| Owner Occupied HU | 7,412 (72.1%) |
| Renter Occupied HU | 2,102 (20.5%) |
| Vacant Housing Units | 762 ( 7.4%) |
| Median Home Value | $1,169,044 |
| Average Home Value | $1,240,940 |
Housing Distribution
Address Breakdown
Residential
9,851
Single Family
7,644
Multi-Family
2,207
Businesses
1,116
Nearby investment properties with comparable rents
Nearby investment properties with comparable prices
Listed by: Tara Coveney • Coldwell Banker Realty - Hingham
Mls Name: MLS PIN
Mls ID: #73468241