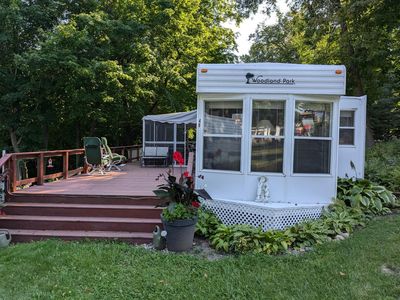
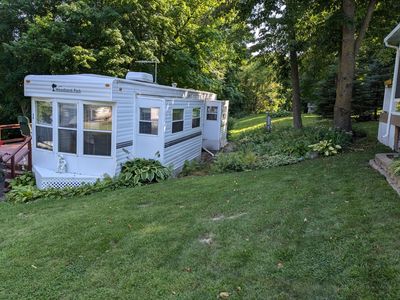
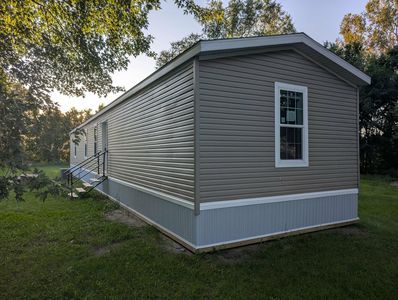
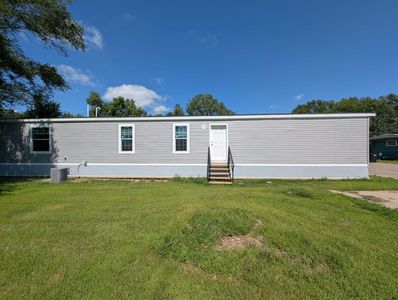
2221 Reubens Ln SW #46FarwellMN56327
INVESTMENT ANALYSIS
Investment Verdict
Appreciation PlayMarkets with strong demand fundamentals often produce low-yield, high-appreciation assets. 2221 Reubens Ln SW #46, Farwell, MN, 56327 in Farwell fits: $135,000, 0% gross yield, and a projected 5% annual appreciation rate adding $37,298 in value within five years. Rental yield 0%. The narrow rent-to-debt spread is the trade-off for market growth. Ziffy Mortgage's DSCR loan (0.00) finances non-U.S. buyers without personal income documentation; optimise coverage with a 30–35% down payment.
| This Property | City Avg | |
|---|---|---|
| Gross Rental Yield | 0% | 7.5% |
| Monthly Cash Flow | $0 | $350 |
City averages based on Farwell market data in our database. Property projections are estimates.
Manufactured
Built in 2003
0.02 sqft lot
$N/A/sqft
$1,250 annually HOA
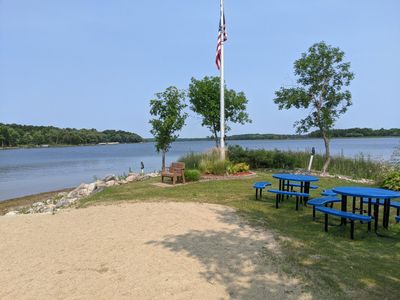
Neighborhood Data
Neighborhood data shown for ZIP Code: 56327, Farwell, MN area.
Housing Distribution
Housing Statistics
| Category | Value |
|---|---|
| Total HU (Housing Units) | 612 (100%) |
| Owner Occupied HU | 353 (57.7%) |
| Renter Occupied HU | 32 ( 5.2%) |
| Vacant Housing Units | 227 (37.1%) |
| Median Home Value | $387,500 |
| Average Home Value | $467,557 |
Housing Distribution
Address Breakdown
Residential
360
Single Family
360
Multi-Family
0
Businesses
6


Nearby investment properties with comparable rents
No similar rental properties found nearby.
Nearby investment properties with comparable prices

Ziffy AI Summary
A quick, investor-focused snapshot highlighting income strength, yield potential.
| Key metrics | Value |
|---|---|
| Price | $399,900 |
| Est. Rent | $3,200/mo |
| ROI | 18% |
- Attractive rent-to-price ratio for income stability
- Good fit for DSCR financing with healthy coverage
Manufactured
Built in 2003
0.02 sqft lot
$N/A/sqft
$1,250 annually HOA
Neighborhood Data
Neighborhood data shown for ZIP Code: 56327, Farwell, MN area.
Housing Distribution
Housing Statistics
| Category | Value |
|---|---|
| Total HU (Housing Units) | 612 (100%) |
| Owner Occupied HU | 353 (57.7%) |
| Renter Occupied HU | 32 ( 5.2%) |
| Vacant Housing Units | 227 (37.1%) |
| Median Home Value | $387,500 |
| Average Home Value | $467,557 |
Housing Distribution
Address Breakdown
Residential
360
Single Family
360
Multi-Family
0
Businesses
6
Nearby investment properties with comparable rents
No similar rental properties found nearby.
Nearby investment properties with comparable prices
Listed by: Paul K Johnson • Alexandria Property Group
Mls Name: NorthstarMLS as distributed by MLS GRID
Mls Provider:
Mls ID: #6716719
Disclaimer: Based on information submitted to the MLS GRID as of 2025-05-08 10:03:01 PDT. All data is obtained from various sources and may not have been verified by broker or MLS GRID. Supplied Open House Information is subject to change without notice. All information should be independently reviewed and verified for accuracy. Properties may or may not be listed by the office/agent presenting the information. Some IDX listings have been excluded from this website. [Click here for more information](/mls-disclaimers/#28) By searching NorthstarMLS listings you agree to the [NorthstarMLS End User License Agreement](https://static1.squarespace.com/static/56c4eea9d51cd483819dae7b/t/56cbe7e32fe13151e10e6b3d/1456203748061/EULA.pdf)