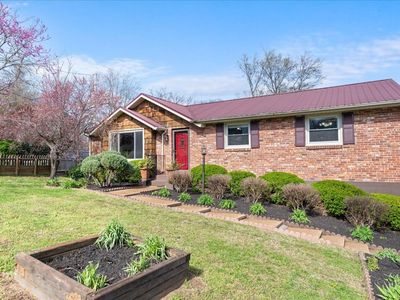
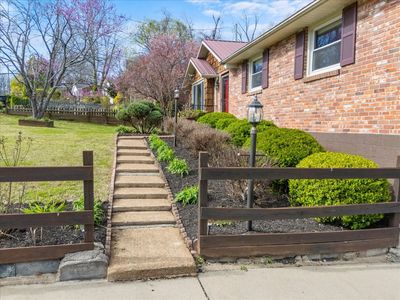
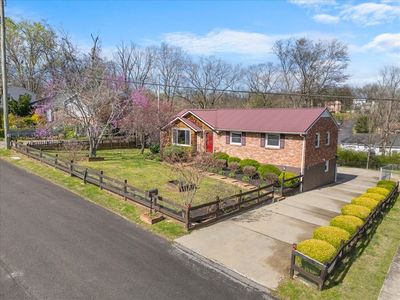
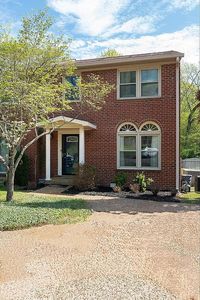
220 Nunley DrNashvilleTN37211
INVESTMENT ANALYSIS
Investment Verdict
Steady Equity BuilderThe cash-flow margin at 220 Nunley Dr, Nashville, TN, 37211 in Nashville is narrow, $138/mo net on $3,400/mo rent after the $2,450/mo debt service, but the property operates at break-even-plus, not a loss. At $544,900 with a 7.49% yield, the long-run equity case via 5% appreciation ($150,546 over five years) and $5,019/yr in principal paydown is where the returns accumulate. Ziffy Mortgage's 1.39 DSCR loan requires no W-2s or U.S. credit. Total projected cumulative return: $215,087.
| This Property | City Avg | |
|---|---|---|
| Gross Rental Yield | 7.5% | 4.2% |
| Monthly Cash Flow | $138 | $850 |
City averages based on Nashville market data in our database. Property projections are estimates.
DSCR Rental Loan Qualification
Qualifies using the property's rental income, not your personal income.
- ✓No W-2, pay stubs, or tax returns needed
- ✓Rental income qualifies you
- ✓Built for real estate investors
| Monthly Rental Income | $3,400 |
| Total Monthly Debt Service | $3,045 |
| DSCR Ratio | 1.12x |
Ziffy Mortgage: Your DSCR most likely meets our 1.0+ requirement, so you'll most probably qualify for our standard DSCR investment loan program. To pre-qualify, book time with your loan officer →
Estimates assume 6.0% rate / 30-yr fixed, 30% down, 1% tax, 0.5% insurance. Not a commitment to lend.
Single Family
Built in 1968
0.34 Acres lot
$N/A/sqft
No HOA
Neighborhood Data
Neighborhood data shown for ZIP Code: 37211, Nashville, TN area.
Housing Distribution
Housing Statistics
| Category | Value |
|---|---|
| Total HU (Housing Units) | 37,568 (100%) |
| Owner Occupied HU | 15,589 (41.5%) |
| Renter Occupied HU | 19,608 (52.2%) |
| Vacant Housing Units | 2,371 ( 6.3%) |
| Median Home Value | $423,382 |
| Average Home Value | $486,554 |
Housing Distribution
Address Breakdown
Residential
35,473
Single Family
22,812
Multi-Family
12,661
Businesses
2,514


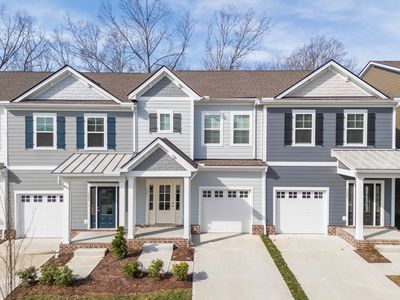
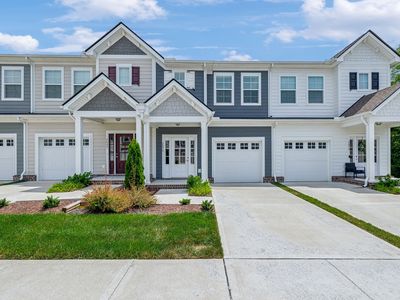
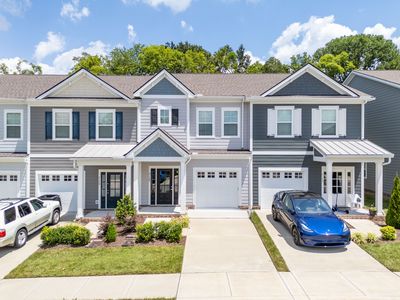
Nearby investment properties with comparable rents
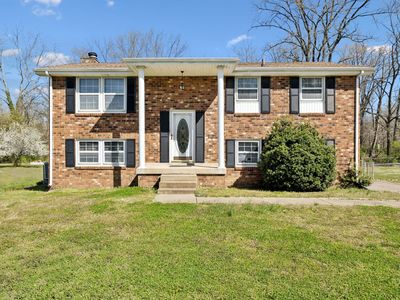
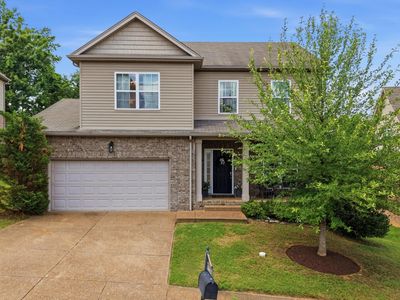
Nearby investment properties with comparable prices
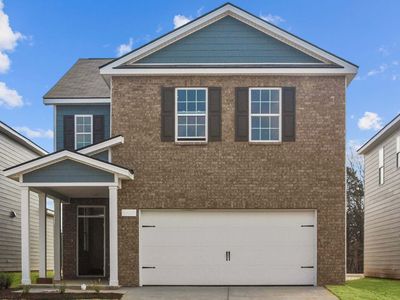

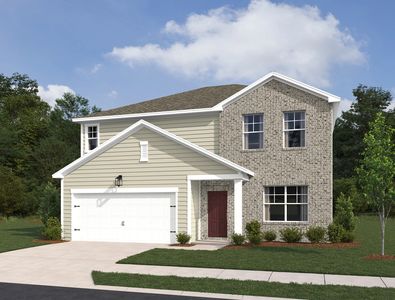
Ziffy AI Summary
A quick, investor-focused snapshot highlighting income strength, yield potential.
| Key metrics | Value |
|---|---|
| Price | $399,900 |
| Est. Rent | $3,200/mo |
| ROI | 18% |
- Attractive rent-to-price ratio for income stability
- Good fit for DSCR financing with healthy coverage
Single Family
Built in 1968
0.34 Acres lot
$N/A/sqft
No HOA
Neighborhood Data
Neighborhood data shown for ZIP Code: 37211, Nashville, TN area.
Housing Distribution
Housing Statistics
| Category | Value |
|---|---|
| Total HU (Housing Units) | 37,568 (100%) |
| Owner Occupied HU | 15,589 (41.5%) |
| Renter Occupied HU | 19,608 (52.2%) |
| Vacant Housing Units | 2,371 ( 6.3%) |
| Median Home Value | $423,382 |
| Average Home Value | $486,554 |
Housing Distribution
Address Breakdown
Residential
35,473
Single Family
22,812
Multi-Family
12,661
Businesses
2,514
Nearby investment properties with comparable rents
Nearby investment properties with comparable prices