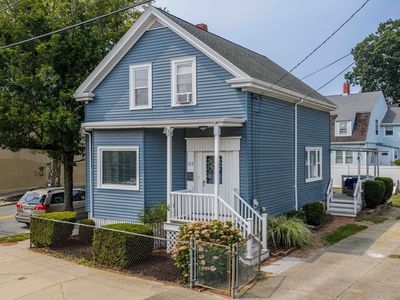
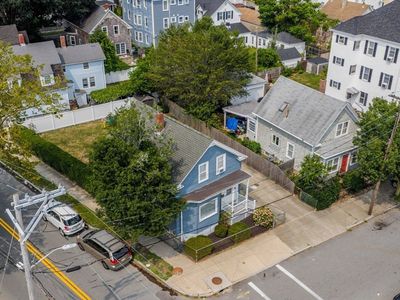
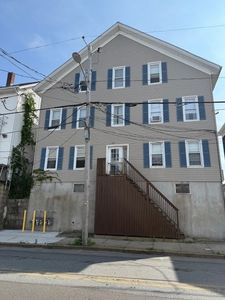
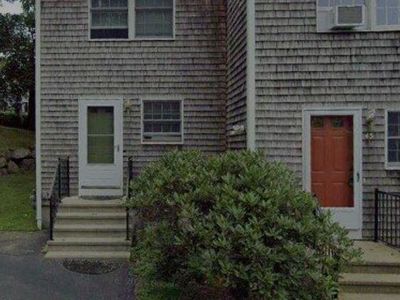
219 Hathaway StNew BedfordMA02746
INVESTMENT ANALYSIS
Investment Verdict
Steady Equity BuilderThe cash-flow margin at 219 Hathaway St, New Bedford, MA, 02746 in New Bedford is narrow, $7/mo net on $2,653/mo rent after the $1,888/mo debt service, but the property operates at break-even-plus, not a loss. At $419,900 with a 7.58% yield, the long-run equity case via 5% appreciation ($116,011 over five years) and $3,867/yr in principal paydown is where the returns accumulate. Ziffy Mortgage's 1.41 DSCR loan requires no W-2s or U.S. credit. Total projected cumulative return: $159,856.
| This Property | City Avg | |
|---|---|---|
| Gross Rental Yield | 7.6% | 6.1% |
| Monthly Cash Flow | $7 | $420 |
City averages based on New Bedford market data in our database. Property projections are estimates.
DSCR Rental Loan Qualification
Qualifies using the property's rental income, not your personal income.
- ✓No W-2, pay stubs, or tax returns needed
- ✓Rental income qualifies you
- ✓Built for real estate investors
| Monthly Rental Income | $2,653 |
| Total Monthly Debt Service | $2,479 |
| DSCR Ratio | 1.07x |
Ziffy Mortgage: Your DSCR most likely meets our 1.0+ requirement, so you'll most probably qualify for our standard DSCR investment loan program. To pre-qualify, book time with your loan officer →
Estimates assume 6.0% rate / 30-yr fixed, 30% down, 1% tax, 0.5% insurance. Not a commitment to lend.
Single Family
Built in 1919
4,704 sqft lot
$N/A/sqft
No HOA
Neighborhood Data
Neighborhood data shown for ZIP Code: 02746, New Bedford, MA area.
Housing Distribution
Housing Statistics
| Category | Value |
|---|---|
| Total HU (Housing Units) | 7,613 (100%) |
| Owner Occupied HU | 1,476 (19.4%) |
| Renter Occupied HU | 5,675 (74.5%) |
| Vacant Housing Units | 462 ( 6.1%) |
| Median Home Value | $332,218 |
| Average Home Value | $328,147 |
Housing Distribution
Address Breakdown
Residential
6,007
Single Family
4,020
Multi-Family
1,987
Businesses
578


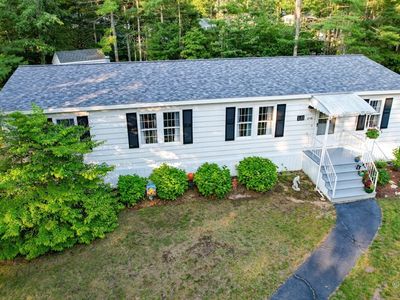
Nearby investment properties with comparable rents

Nearby investment properties with comparable prices

Ziffy AI Summary
A quick, investor-focused snapshot highlighting income strength, yield potential.
| Key metrics | Value |
|---|---|
| Price | $399,900 |
| Est. Rent | $3,200/mo |
| ROI | 18% |
- Attractive rent-to-price ratio for income stability
- Good fit for DSCR financing with healthy coverage
Single Family
Built in 1919
4,704 sqft lot
$N/A/sqft
No HOA
Neighborhood Data
Neighborhood data shown for ZIP Code: 02746, New Bedford, MA area.
Housing Distribution
Housing Statistics
| Category | Value |
|---|---|
| Total HU (Housing Units) | 7,613 (100%) |
| Owner Occupied HU | 1,476 (19.4%) |
| Renter Occupied HU | 5,675 (74.5%) |
| Vacant Housing Units | 462 ( 6.1%) |
| Median Home Value | $332,218 |
| Average Home Value | $328,147 |
Housing Distribution
Address Breakdown
Residential
6,007
Single Family
4,020
Multi-Family
1,987
Businesses
578
Nearby investment properties with comparable rents
Nearby investment properties with comparable prices
Listed by: Tyler DaSilva • LPT Realty - Home & Key Group
Mls Name: MLS PIN
Mls ID: #73421817