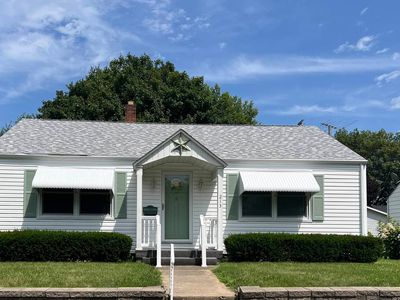
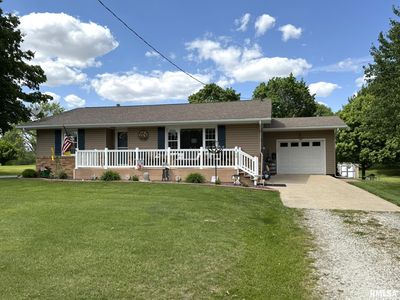
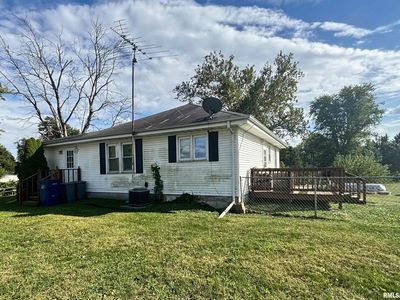
213 S 10th StMonmouthIL61462
INVESTMENT ANALYSIS
Investment Verdict
Strong Cash FlowSolid fundamentals define the investment case at 213 S 10th St, Monmouth, IL, 61462 in Monmouth: $1,178/mo in rent, $354/mo in net income, 11.89% gross yield, 2.20 DSCR, all at $118,900. Ziffy Mortgage's DSCR mortgage qualifies using the property's income alone, clearing approval without U.S. residency or credit. Five-year equity from $32,850 in appreciation and $1,095/yr in principal paydown projects total cumulative return of $68,228.
| This Property | City Avg | |
|---|---|---|
| Gross Rental Yield | 11.9% | 7.0% |
| Monthly Cash Flow | $354 | $900 |
City averages based on Monmouth market data in our database. Property projections are estimates.
DSCR Rental Loan Qualification
Qualifies using the property's rental income, not your personal income.
- ✓No W-2, pay stubs, or tax returns needed
- ✓Rental income qualifies you
- ✓Built for real estate investors
| Monthly Rental Income | $1,178 |
| Total Monthly Debt Service | $777 |
| DSCR Ratio | 1.52x |
Ziffy Mortgage: Your DSCR most likely meets our 1.0+ requirement, so you'll most probably qualify for our standard DSCR investment loan program. To pre-qualify, book time with your loan officer →
Estimates assume 6.0% rate / 30-yr fixed, 30% down, 1% tax, 0.5% insurance. Not a commitment to lend.
Single Family
Built in 1942
4,950 sqft lot
$N/A/sqft
No HOA
Neighborhood Data
Neighborhood data shown for ZIP Code: 61462, Monmouth, IL area.
Housing Distribution
Housing Statistics
| Category | Value |
|---|---|
| Total HU (Housing Units) | 4,818 (100%) |
| Owner Occupied HU | 3,039 (63.1%) |
| Renter Occupied HU | 1,128 (23.4%) |
| Vacant Housing Units | 651 (13.5%) |
| Median Home Value | $112,163 |
| Average Home Value | $161,049 |
Housing Distribution
Address Breakdown
Residential
4,397
Single Family
4,029
Multi-Family
368
Businesses
399


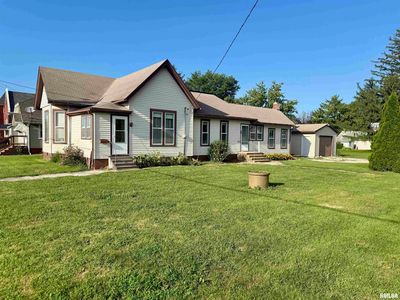
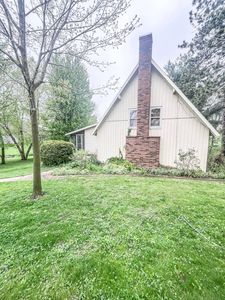
Nearby investment properties with comparable rents
Nearby investment properties with comparable prices

Ziffy AI Summary
A quick, investor-focused snapshot highlighting income strength, yield potential.
| Key metrics | Value |
|---|---|
| Price | $399,900 |
| Est. Rent | $3,200/mo |
| ROI | 18% |
- Attractive rent-to-price ratio for income stability
- Good fit for DSCR financing with healthy coverage
Single Family
Built in 1942
4,950 sqft lot
$N/A/sqft
No HOA
Neighborhood Data
Neighborhood data shown for ZIP Code: 61462, Monmouth, IL area.
Housing Distribution
Housing Statistics
| Category | Value |
|---|---|
| Total HU (Housing Units) | 4,818 (100%) |
| Owner Occupied HU | 3,039 (63.1%) |
| Renter Occupied HU | 1,128 (23.4%) |
| Vacant Housing Units | 651 (13.5%) |
| Median Home Value | $112,163 |
| Average Home Value | $161,049 |
Housing Distribution
Address Breakdown
Residential
4,397
Single Family
4,029
Multi-Family
368
Businesses
399
Nearby investment properties with comparable rents
Nearby investment properties with comparable prices