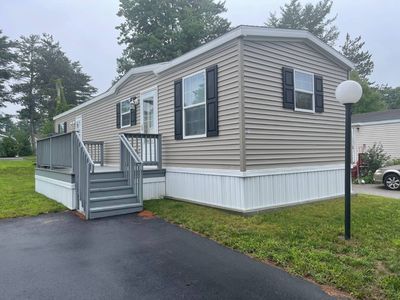
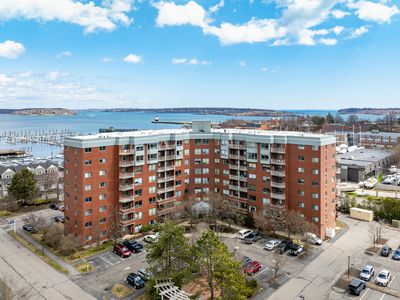
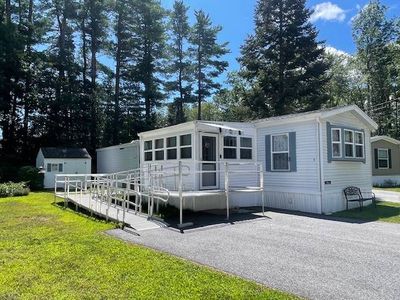
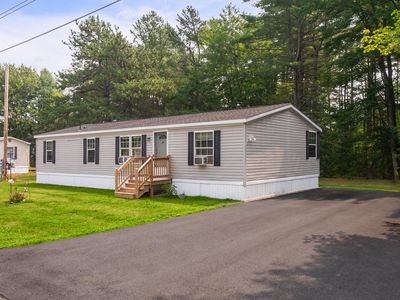
21 Mayflower DrOld Orchard BeachME04064


Nearby investment properties with comparable rents
Nearby investment properties with comparable prices

Ziffy AI Summary
A quick, investor-focused snapshot highlighting income strength, yield potential.
| Key metrics | Value |
|---|---|
| Price | $399,900 |
| Est. Rent | $3,200/mo |
| ROI | 18% |
- Attractive rent-to-price ratio for income stability
- Good fit for DSCR financing with healthy coverage
Investment Highlights
Investment property for sale in Old Orchard Beach at 21 Mayflower Dr, Old Orchard Beach, ME, 04064 with 5% annual appreciation on a $164,900 basis while $2,570/mo rent supports operations. Total monthly income totals $2,570/mo and a $807/mo payment preserves $826/mo for cash returns. Annual cash flow comes to $9,917/yr on $54,664 deployed, and return on cash invested reaches 38.05% in year one. Equity gained on principal adds $1,064/yr, and five-year appreciation sums $45,559 alongside rental yield of 18.7%. Five-year ROI measures 205.92% and total cumulative return in cash totals $112,564.
Investors can finance this property with Ziffy Mortgage’s DSCR loan that underwrites to $2,570/mo property income versus a $807/mo payment rather than your W2s, Paystubs, Tax returns, or 1099 forms.
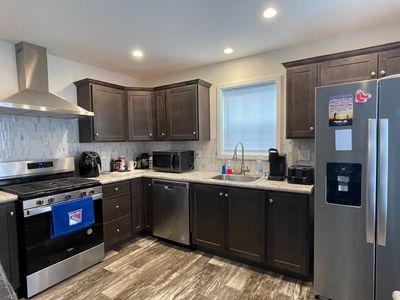
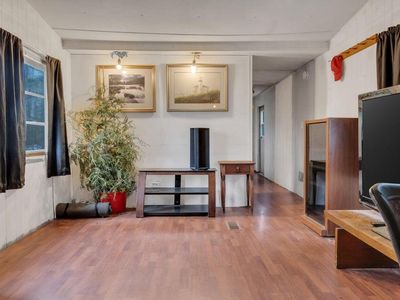
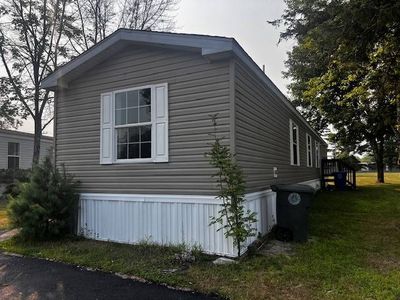
Manufactured
Built in 2023
N/A lot
$N/A/sqft
$703 monthly HOA
Neighborhood Data
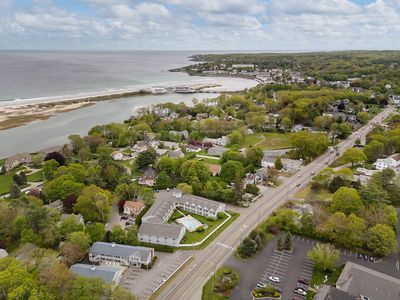
Neighborhood data shown for ZIP Code: 04064, Old Orchard Beach, ME area.
Housing Distribution
Housing Statistics
| Category | Value |
|---|---|
| Total HU (Housing Units) | 6,998 (100%) |
| Owner Occupied HU | 3,397 (48.5%) |
| Renter Occupied HU | 1,513 (21.6%) |
| Vacant Housing Units | 2,088 (29.8%) |
| Median Home Value | $437,987 |
| Average Home Value | $477,398 |
Housing Distribution
Address Breakdown
Residential
6,370
Single Family
5,809
Multi-Family
561
Businesses
355
Nearby investment properties with comparable rents
Nearby investment properties with comparable prices
Listed by: Kathee Somes • Mobile Home Brokers Unlimited
Mls Name: My State MLS
Mls ID: #11335296