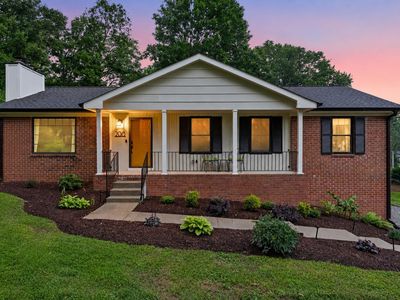
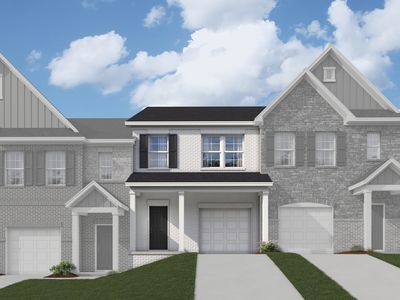
208 Norway TerNashvilleTN37211

INVESTMENT ANALYSIS
Investment Verdict
Steady Equity BuilderThis Nashville rental at 208 Norway Ter, Nashville, TN, 37211 sits in the solid-income band: 7.75% gross yield, $3,229/mo rent, $237/mo net after the $2,248/mo debt service, DSCR 1.44. Entry price of $499,900 is well-calibrated for the income it produces. Ziffy Mortgage finances this type of asset on rental income alone, no tax returns, no U.S. credit profile. Projected five-year appreciation of $138,113 and $4,604/yr in principal reduction bring total cumulative return to $204,354.
| This Property | City Avg | |
|---|---|---|
| Gross Rental Yield | 7.8% | 4.2% |
| Monthly Cash Flow | $237 | $850 |
City averages based on Nashville market data in our database. Property projections are estimates.
DSCR Rental Loan Qualification
Qualifies using the property's rental income, not your personal income.
- ✓No W-2, pay stubs, or tax returns needed
- ✓Rental income qualifies you
- ✓Built for real estate investors
| Monthly Rental Income | $3,229 |
| Total Monthly Debt Service | $2,794 |
| DSCR Ratio | 1.16x |
Ziffy Mortgage: Your DSCR most likely meets our 1.0+ requirement, so you'll most probably qualify for our standard DSCR investment loan program. To pre-qualify, book time with your loan officer →
Estimates assume 6.0% rate / 30-yr fixed, 30% down, 1% tax, 0.5% insurance. Not a commitment to lend.
Single Family
Built in 1980
0.28 Acres lot
$N/A/sqft
No HOA
Neighborhood Data
Neighborhood data shown for ZIP Code: 37211, Nashville, TN area.
Housing Distribution
Housing Statistics
| Category | Value |
|---|---|
| Total HU (Housing Units) | 37,568 (100%) |
| Owner Occupied HU | 15,589 (41.5%) |
| Renter Occupied HU | 19,608 (52.2%) |
| Vacant Housing Units | 2,371 ( 6.3%) |
| Median Home Value | $423,382 |
| Average Home Value | $486,554 |
Housing Distribution
Address Breakdown
Residential
35,473
Single Family
22,812
Multi-Family
12,661
Businesses
2,514


Nearby investment properties with comparable rents

Nearby investment properties with comparable prices


Ziffy AI Summary
A quick, investor-focused snapshot highlighting income strength, yield potential.
| Key metrics | Value |
|---|---|
| Price | $399,900 |
| Est. Rent | $3,200/mo |
| ROI | 18% |
- Attractive rent-to-price ratio for income stability
- Good fit for DSCR financing with healthy coverage
Single Family
Built in 1980
0.28 Acres lot
$N/A/sqft
No HOA
Neighborhood Data
Neighborhood data shown for ZIP Code: 37211, Nashville, TN area.
Housing Distribution
Housing Statistics
| Category | Value |
|---|---|
| Total HU (Housing Units) | 37,568 (100%) |
| Owner Occupied HU | 15,589 (41.5%) |
| Renter Occupied HU | 19,608 (52.2%) |
| Vacant Housing Units | 2,371 ( 6.3%) |
| Median Home Value | $423,382 |
| Average Home Value | $486,554 |
Housing Distribution
Address Breakdown
Residential
35,473
Single Family
22,812
Multi-Family
12,661
Businesses
2,514
Nearby investment properties with comparable rents
Nearby investment properties with comparable prices
Listed by: Brianna Morant • Benchmark Realty, LLC
Mls Name: RealTracs MLS as distributed by MLS GRID
Mls Provider:
Mls ID: #3229337
Disclaimer: Based on information submitted to the MLS GRID as of 2026-06-04 07:53:13 PDT. All data is obtained from various sources and may not have been verified by broker or MLS GRID. Supplied Open House Information is subject to change without notice. All information should be independently reviewed and verified for accuracy. Properties may or may not be listed by the office/agent presenting the information. Some IDX listings have been excluded from this website. [Click here for more information](/mls-disclaimers/#99)