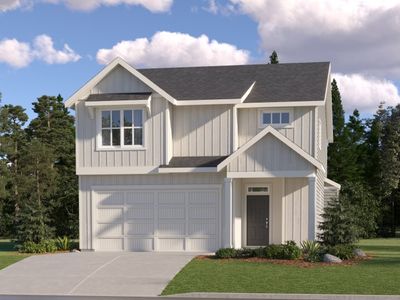
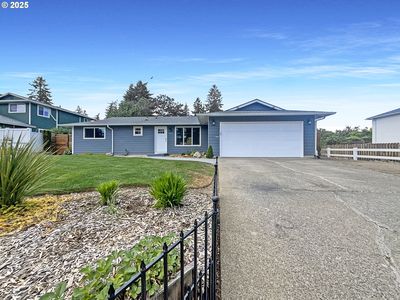
2065 SE Pheasant AveGreshamOR97080


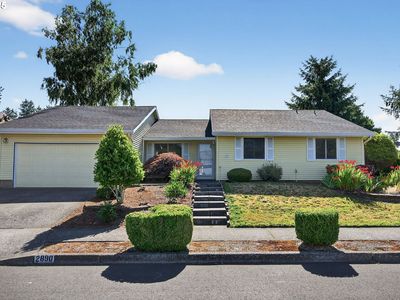
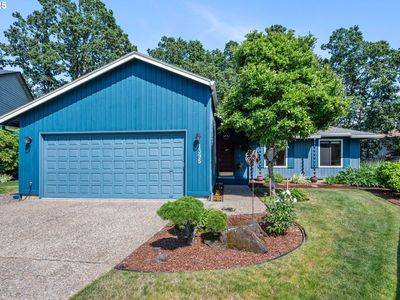
Nearby investment properties with comparable rents
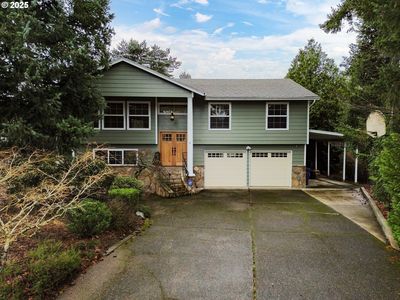
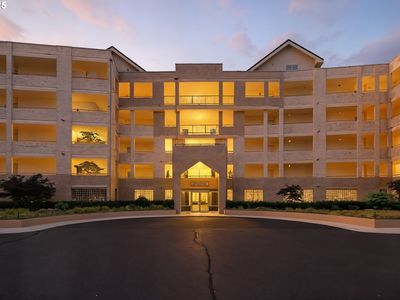
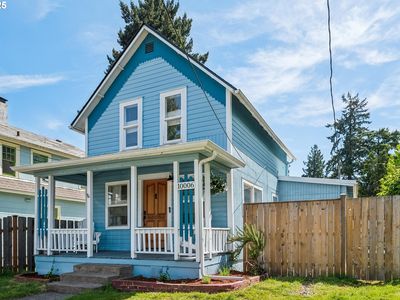

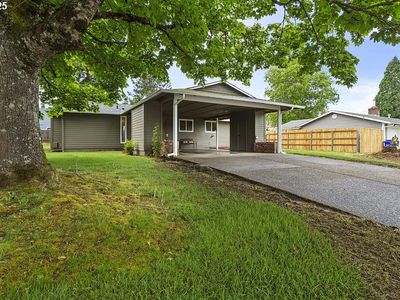
Nearby investment properties with comparable prices

Ziffy AI Summary
A quick, investor-focused snapshot highlighting income strength, yield potential.
| Key metrics | Value |
|---|---|
| Price | $399,900 |
| Est. Rent | $3,200/mo |
| ROI | 18% |
- Attractive rent-to-price ratio for income stability
- Good fit for DSCR financing with healthy coverage
Investment Highlights
Investment property for sale in Gresham at 2065 SE Pheasant Ave, Gresham, OR, 97080 with 5% annual appreciation on a $553,900 basis while $3,420/mo rent supports operations. Total monthly income totals $3,420/mo and a $2,711/mo payment preserves $77/mo for cash returns. Annual cash flow comes to $920/yr on $182,233 deployed, and return on cash invested reaches 20.56% in year one. Equity gained on principal adds $3,574/yr, and five-year appreciation sums $153,032 alongside rental yield of 7.41%. Five-year ROI measures 106.14% and total cumulative return in cash totals $193,414.
Investors can finance this property with Ziffy Mortgage’s DSCR loan that underwrites to $3,420/mo property income versus a $2,711/mo payment rather than your W2s, Paystubs, Tax returns, or 1099 forms.
Single Family
Built in 2025
N/A lot
$N/A/sqft
No HOA
Neighborhood Data
Neighborhood data shown for ZIP Code: 97080, Gresham, OR area.
Housing Distribution
Housing Statistics
| Category | Value |
|---|---|
| Total HU (Housing Units) | 17,539 (100%) |
| Owner Occupied HU | 11,922 (68.0%) |
| Renter Occupied HU | 4,987 (28.4%) |
| Vacant Housing Units | 630 ( 3.6%) |
| Median Home Value | $549,956 |
| Average Home Value | $572,194 |
Housing Distribution
Address Breakdown
Residential
16,673
Single Family
16,065
Multi-Family
608
Businesses
198
Nearby investment properties with comparable rents
Nearby investment properties with comparable prices