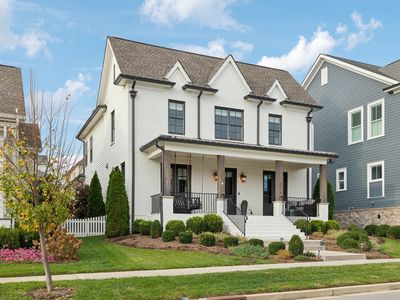
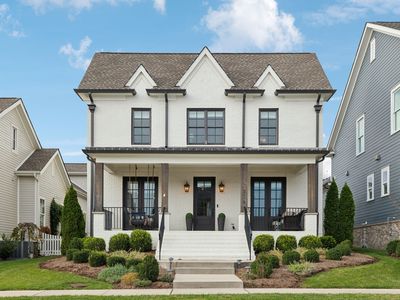
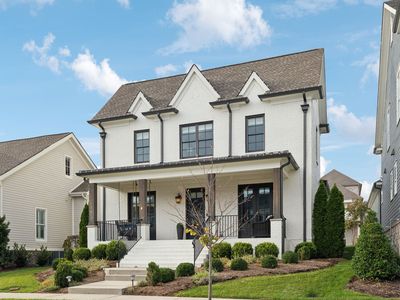
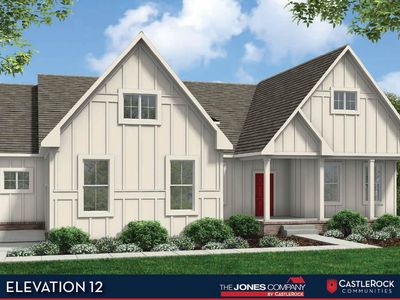
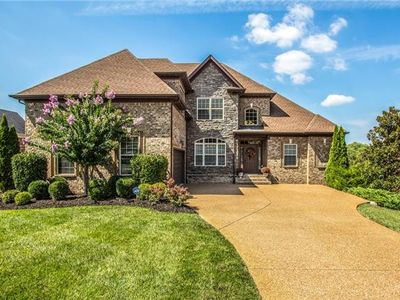
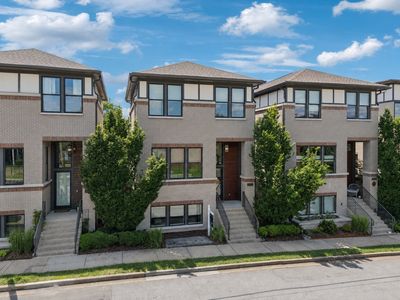
2016 Garfield StNashvilleTN37221
INVESTMENT ANALYSIS
Investment Verdict
Appreciation PlayThe investment thesis at 2016 Garfield St, Nashville, TN, 37221 in Nashville is capital appreciation. Rental yield 5.59%. The 5.59% gross yield at $1,100,000 falls below cash-flow thresholds, but 5% annual value growth is forecast to deliver $303,910 in additional equity by year five, an equity gain that can outpace many higher-yield markets. Ziffy Mortgage finances appreciation-play assets via DSCR (1.04) without U.S. credit history; structure with a larger down payment to optimise coverage. Total projected return: $314,843.
| This Property | City Avg | |
|---|---|---|
| Gross Rental Yield | 5.6% | 4.2% |
| Monthly Cash Flow | $(1,582) | $850 |
City averages based on Nashville market data in our database. Property projections are estimates.
DSCR Rental Loan Qualification
Qualifies using the property's rental income, not your personal income.
- ✓No W-2, pay stubs, or tax returns needed
- ✓Rental income qualifies you
- ✓Built for real estate investors
| Monthly Rental Income | $5,120 |
| Total Monthly Debt Service | $6,265 |
| DSCR Ratio | 0.82x |
Ziffy Mortgage typically prefers a DSCR of 1.0+, but in some cases you may qualify with a DSCR below 1. To explore if this deal qualifies for an investment mortgage, book time with your loan officer →
Estimates assume 6.0% rate / 30-yr fixed, 30% down, 1% tax, 0.5% insurance. Not a commitment to lend.
Single Family
Built in 2019
6,098 sqft lot
$N/A/sqft
$354 quarterly HOA
Neighborhood Data
Neighborhood data shown for ZIP Code: 37221, Nashville, TN area.
Housing Distribution
Housing Statistics
| Category | Value |
|---|---|
| Total HU (Housing Units) | 21,121 (100%) |
| Owner Occupied HU | 13,081 (61.9%) |
| Renter Occupied HU | 6,824 (32.3%) |
| Vacant Housing Units | 1,216 ( 5.8%) |
| Median Home Value | $481,109 |
| Average Home Value | $577,926 |
Housing Distribution
Address Breakdown
Residential
19,993
Single Family
15,032
Multi-Family
4,961
Businesses
844


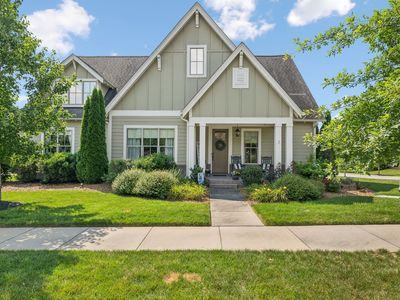
Nearby investment properties with comparable rents
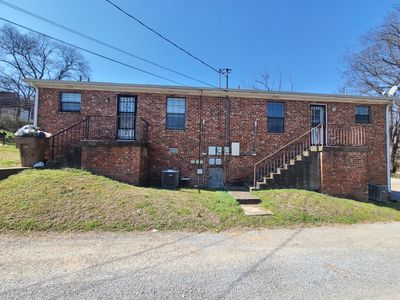
Nearby investment properties with comparable prices


Ziffy AI Summary
A quick, investor-focused snapshot highlighting income strength, yield potential.
| Key metrics | Value |
|---|---|
| Price | $399,900 |
| Est. Rent | $3,200/mo |
| ROI | 18% |
- Attractive rent-to-price ratio for income stability
- Good fit for DSCR financing with healthy coverage
Single Family
Built in 2019
6,098 sqft lot
$N/A/sqft
$354 quarterly HOA
Neighborhood Data
Neighborhood data shown for ZIP Code: 37221, Nashville, TN area.
Housing Distribution
Housing Statistics
| Category | Value |
|---|---|
| Total HU (Housing Units) | 21,121 (100%) |
| Owner Occupied HU | 13,081 (61.9%) |
| Renter Occupied HU | 6,824 (32.3%) |
| Vacant Housing Units | 1,216 ( 5.8%) |
| Median Home Value | $481,109 |
| Average Home Value | $577,926 |
Housing Distribution
Address Breakdown
Residential
19,993
Single Family
15,032
Multi-Family
4,961
Businesses
844
Nearby investment properties with comparable rents
Nearby investment properties with comparable prices
Listed by: Heather Sisemore Warmbrod • Wilson Group Real Estate
Mls Name: RealTracs MLS as distributed by MLS GRID
Mls Provider:
Mls ID: #2815322
Disclaimer: Based on information submitted to the MLS GRID as of 2025-04-11 07:43:03 PDT. All data is obtained from various sources and may not have been verified by broker or MLS GRID. Supplied Open House Information is subject to change without notice. All information should be independently reviewed and verified for accuracy. Properties may or may not be listed by the office/agent presenting the information. Some IDX listings have been excluded from this website. [Click here for more information](/mls-disclaimers/#99)