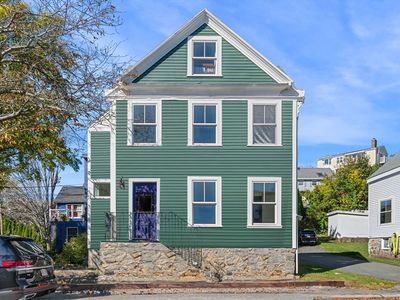
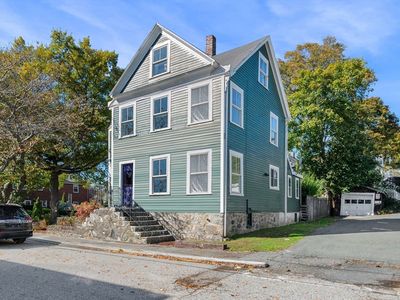
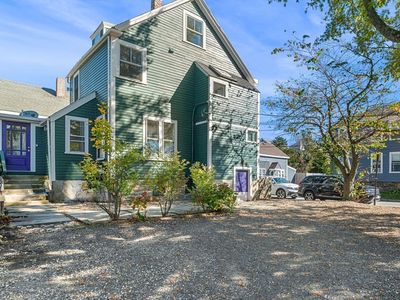
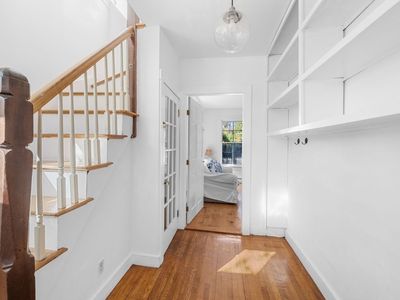
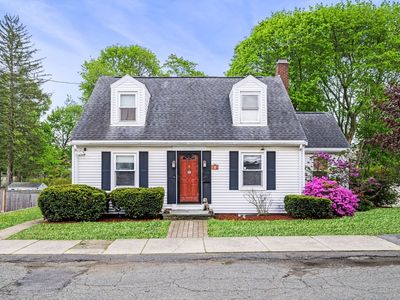
2 Lindsey StMarbleheadMA01945


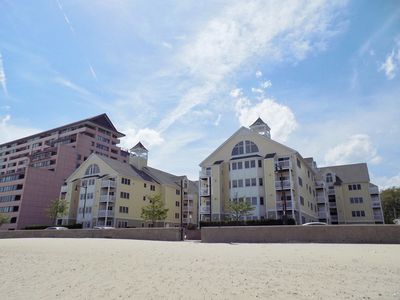
Nearby investment properties with comparable rents

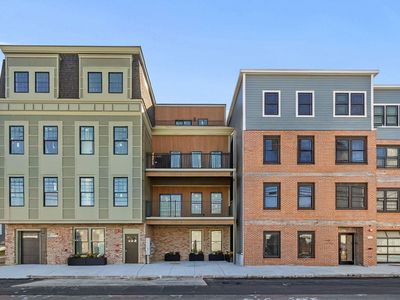
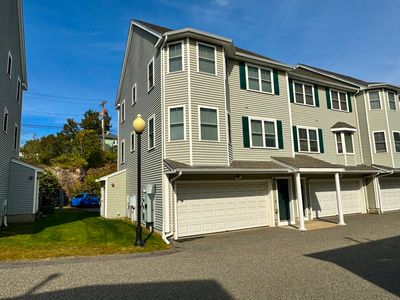
Nearby investment properties with comparable prices


Ziffy AI Summary
A quick, investor-focused snapshot highlighting income strength, yield potential.
| Key metrics | Value |
|---|---|
| Price | $399,900 |
| Est. Rent | $3,200/mo |
| ROI | 18% |
- Attractive rent-to-price ratio for income stability
- Good fit for DSCR financing with healthy coverage
Investment Highlights
Investment property for sale in Marblehead at 2 Lindsey St, Marblehead, MA, 01945 earns $315/mo cash flow from $4,944/mo rent with a $3,595/mo payment. Total monthly income totals $4,944/mo, and annual cash flow totals $3,775/yr on $241,651 capital. ROI tracks 21.62% on current figures, and rental yield reads 8.08% at a $734,500 purchase. Equity gained on principal adds $4,740/yr, and 5% annual appreciation supports $202,929 over five years. Five-year ROI reaches 112.15% and total cumulative return in cash sums $271,007. Financing can be set up with Ziffy Mortgage’s DSCR loan, which is driven by $4,944/mo property income instead of your personal income.
Single Family
Built in 1880
2,339 sqft lot
$N/A/sqft
No HOA
Neighborhood Data
Neighborhood data shown for ZIP Code: 01945, Marblehead, MA area.
Housing Distribution
Housing Statistics
| Category | Value |
|---|---|
| Total HU (Housing Units) | 8,975 (100%) |
| Owner Occupied HU | 6,644 (74.0%) |
| Renter Occupied HU | 1,712 (19.1%) |
| Vacant Housing Units | 619 ( 6.9%) |
| Median Home Value | $959,132 |
| Average Home Value | $1,107,514 |
Housing Distribution
Address Breakdown
Residential
8,778
Single Family
8,126
Multi-Family
652
Businesses
936
Nearby investment properties with comparable rents
Nearby investment properties with comparable prices
Listed by: Kristen Gaughan • William Raveis R.E. & Home Services
Mls Name: MLS PIN
Mls ID: #73448519